Fig. 1.
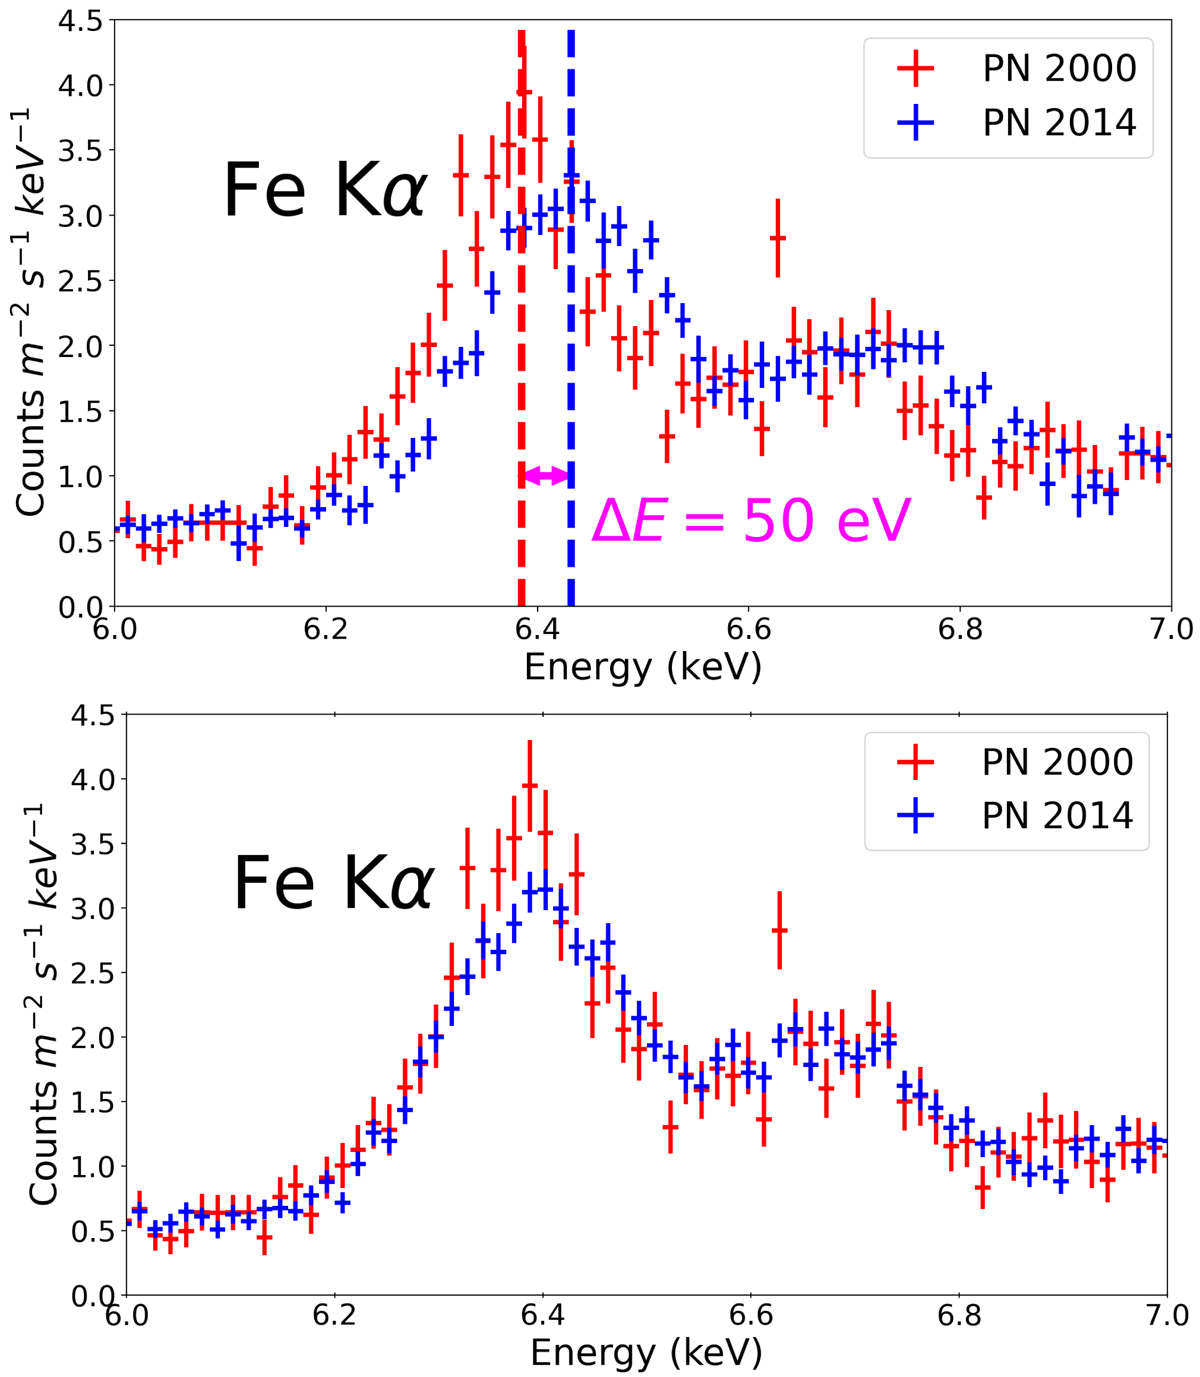
Comparing the Fe Kα line in 2000 (red crosses) and 2014 (blue crosses). Top: there is a clear shift in the Fe Kα line between these two epochs, denoted by the red and blue dashed vertical lines at the peak energies of the observed data. The magenta arrow signifies this energy shift between the observations, equivalent to ΔE = 50 eV. This shift is due to uncertainties in the long-term charge transfer inefficiency and instrumental gain (Cappi et al. 2016). Bottom: we account for this shift manually by multiplying the energies (PI) of the event lists in each 2014 observation by 0.993. Now the 2014 PN data are consistent with the 2000 data and the correction is sufficient for modelling.
Current usage metrics show cumulative count of Article Views (full-text article views including HTML views, PDF and ePub downloads, according to the available data) and Abstracts Views on Vision4Press platform.
Data correspond to usage on the plateform after 2015. The current usage metrics is available 48-96 hours after online publication and is updated daily on week days.
Initial download of the metrics may take a while.