Fig. 4.
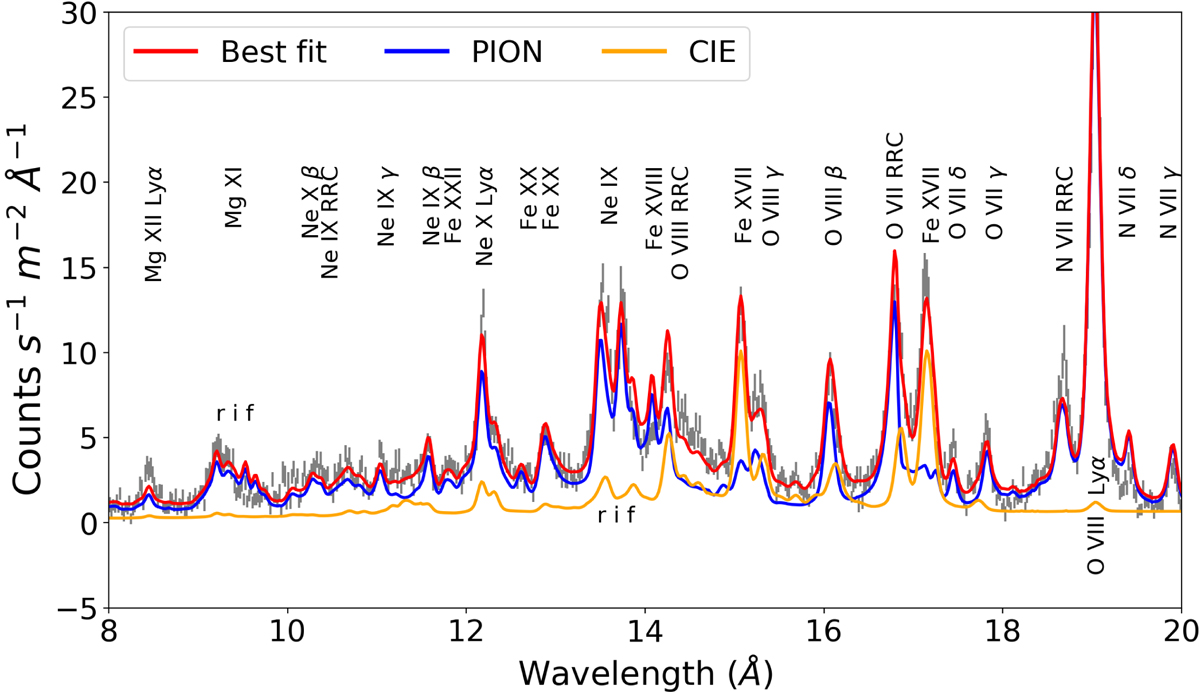
RGS spectrum (grey points) between 8 and 20 Å from the 2000 observation of NGC 1068. The red line shows the best fit model and the blue line displays the photoionisation model made up of four different PION components, fitting the majority of the emission lines in both the RGS and PN spectra, except for the features at 15 and 17 Å. We therefore introduced a collisionally ionised component (CIE; orange line) to account for these emission lines from Fe XVII.
Current usage metrics show cumulative count of Article Views (full-text article views including HTML views, PDF and ePub downloads, according to the available data) and Abstracts Views on Vision4Press platform.
Data correspond to usage on the plateform after 2015. The current usage metrics is available 48-96 hours after online publication and is updated daily on week days.
Initial download of the metrics may take a while.