Fig. 5.
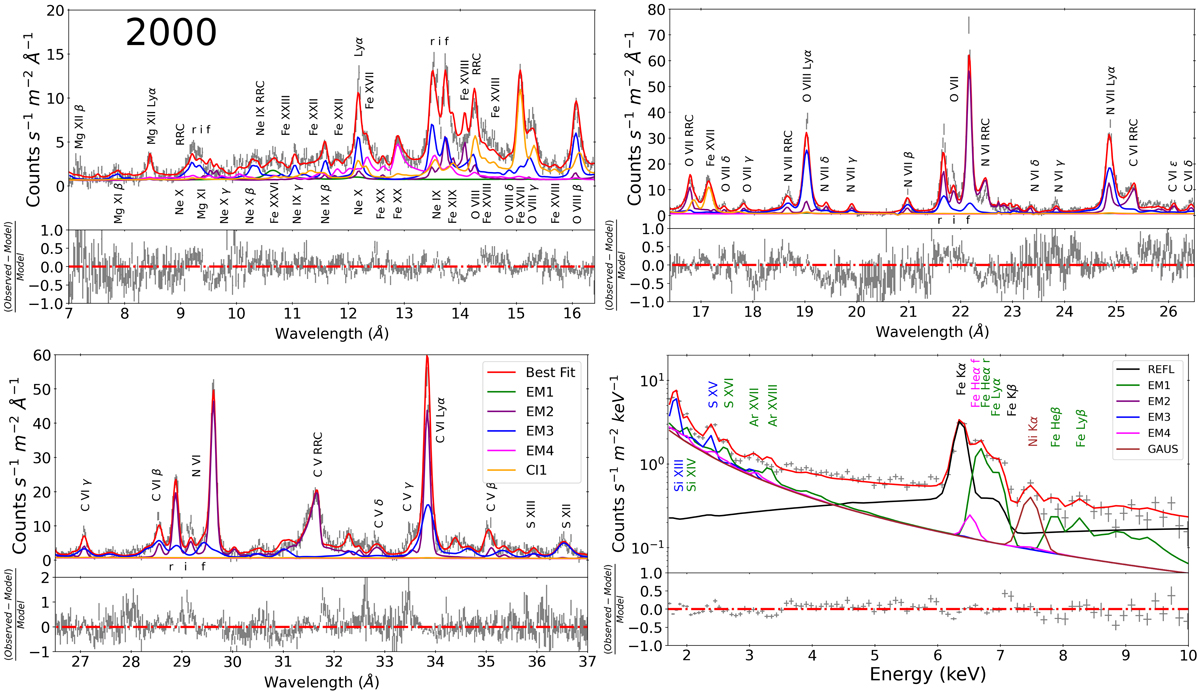
Best fit model to the 2000 spectrum of NGC 1068. We plot the soft X-ray (RGS) band in wavelength units and the hard X-ray (EPIC-PN) band in energy units for display purposes. The red line shows the best fit to the data points (grey crosses) and the other coloured lines (labelled in the legends) represent each component in the model. Bottom panels: residuals between the best fit model and the observed data points.
Current usage metrics show cumulative count of Article Views (full-text article views including HTML views, PDF and ePub downloads, according to the available data) and Abstracts Views on Vision4Press platform.
Data correspond to usage on the plateform after 2015. The current usage metrics is available 48-96 hours after online publication and is updated daily on week days.
Initial download of the metrics may take a while.