Fig. 7.
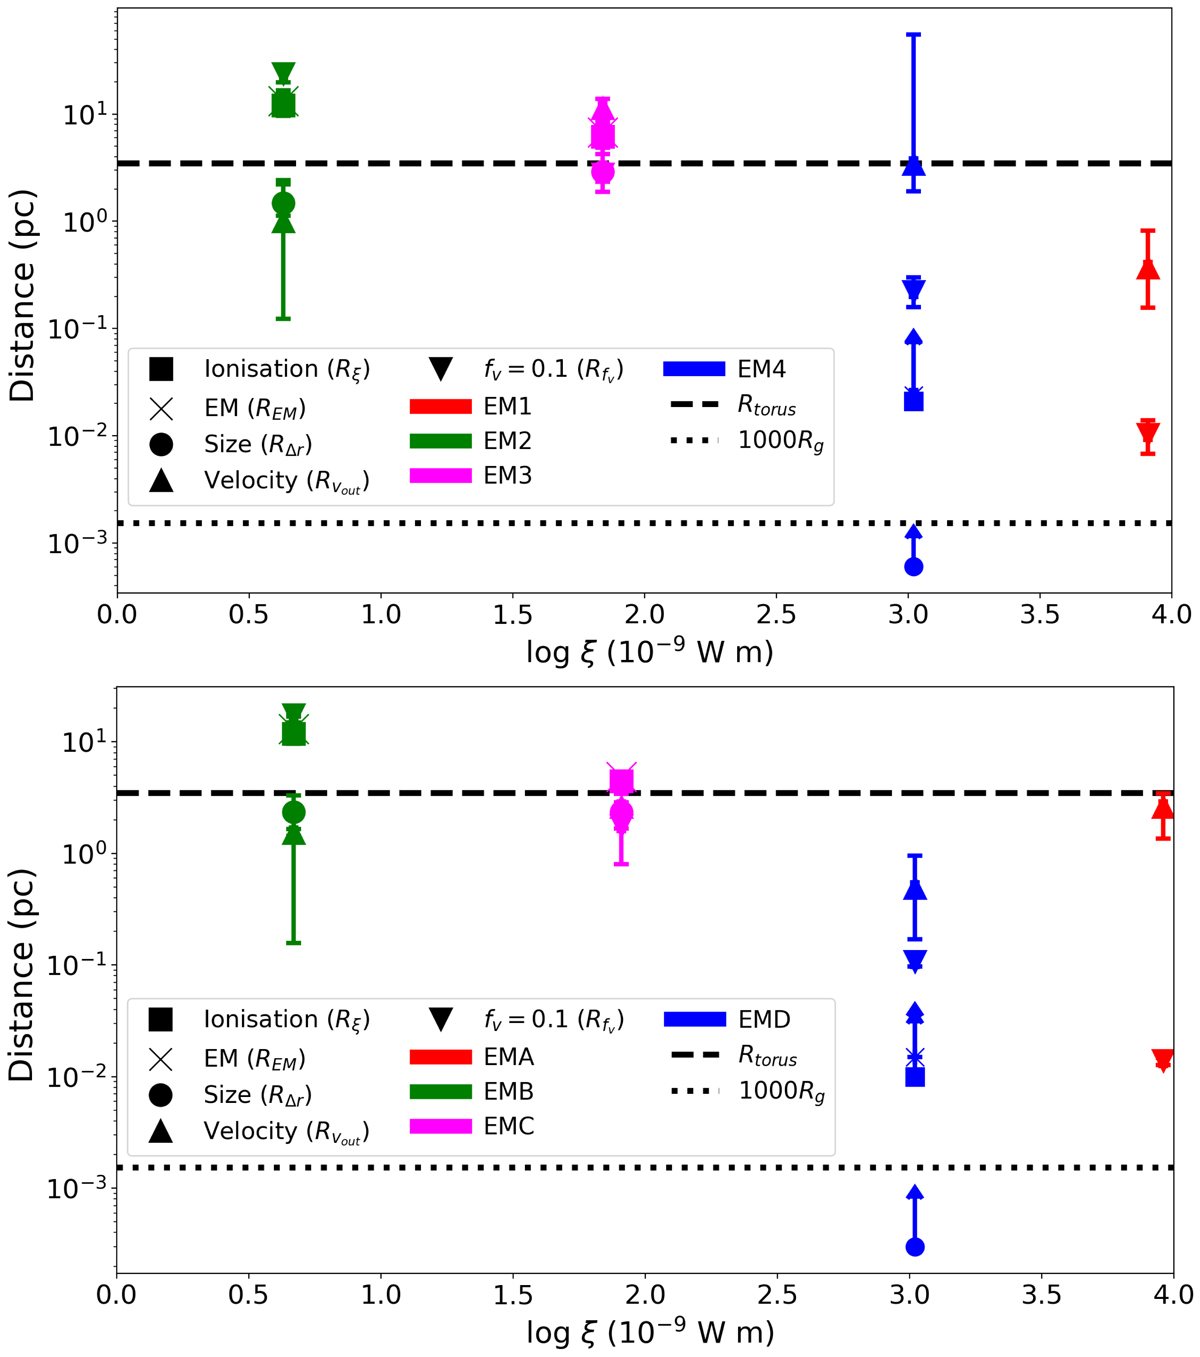
Distances of each component are plotted for the different methods in Sect. 7.1, at the respective ionisation parameters for 2000 (top) and 2014 (bottom). The data point shapes are shown in the legend, as are the colours for each component. The dashed line in each plot represents the location of the torus, at rtorus = 3.5 pc (García-Burillo et al. 2016), while the dotted line is at 1000 gravitational radii (![]() ) from the SMBH, corresponding to a typical outer disk radius (Netzer 2013).
) from the SMBH, corresponding to a typical outer disk radius (Netzer 2013).
Current usage metrics show cumulative count of Article Views (full-text article views including HTML views, PDF and ePub downloads, according to the available data) and Abstracts Views on Vision4Press platform.
Data correspond to usage on the plateform after 2015. The current usage metrics is available 48-96 hours after online publication and is updated daily on week days.
Initial download of the metrics may take a while.