Fig. 8.
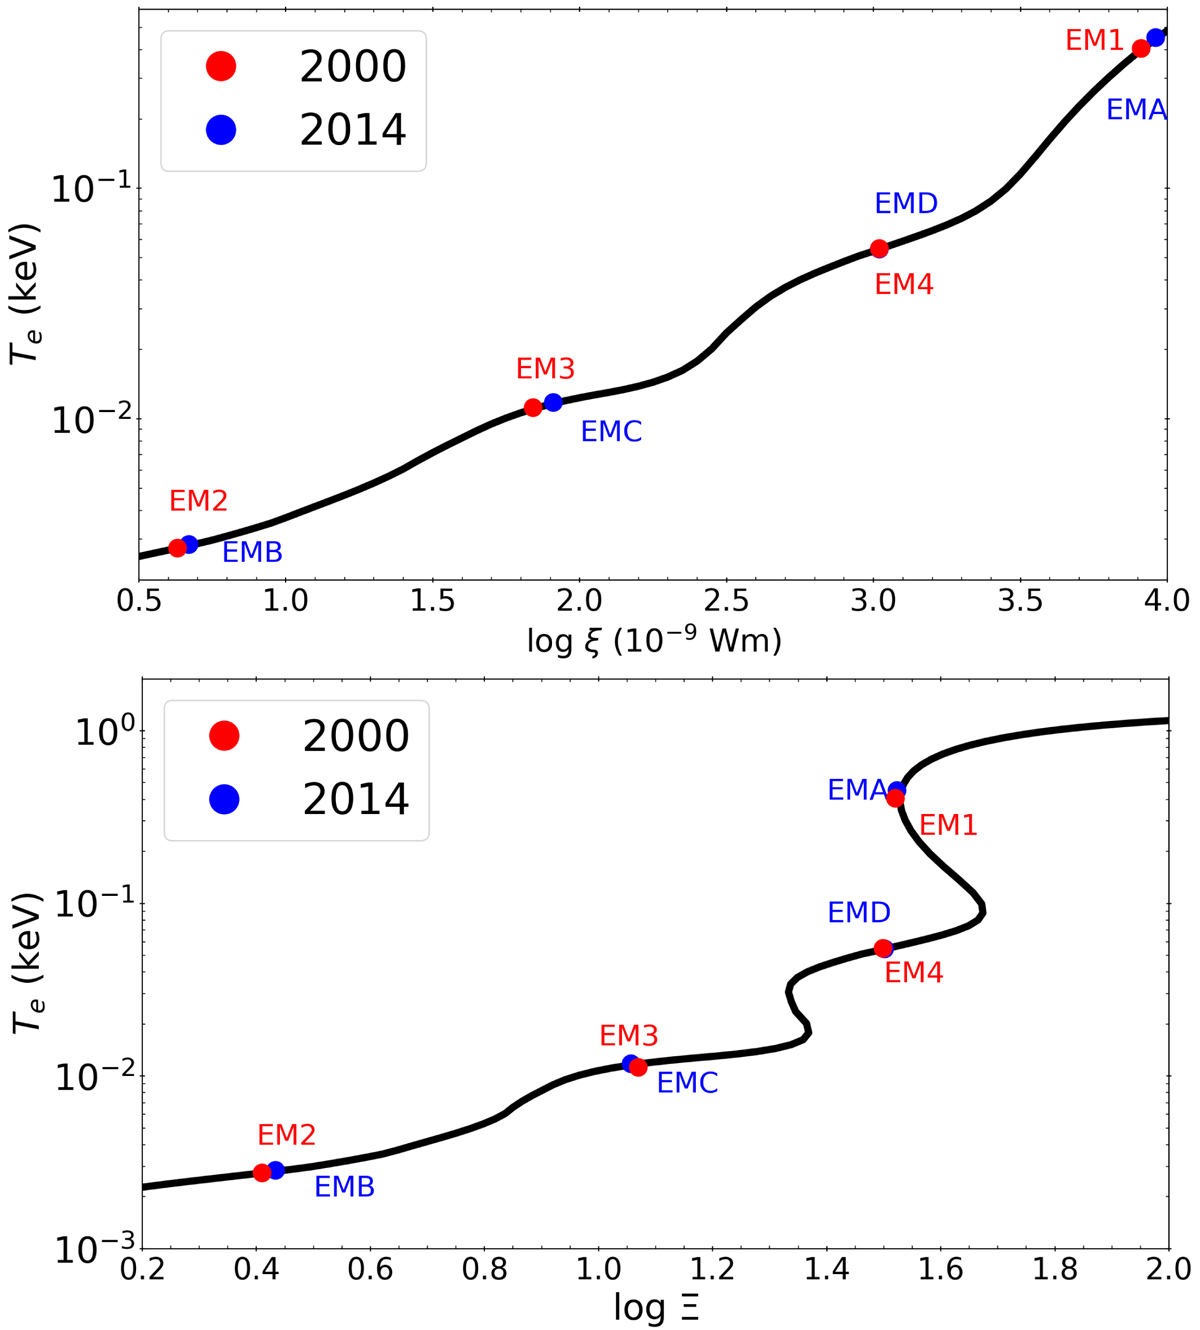
Top panel: electron temperature (Te) of the plasma as a function of ionisation parameter (ξ). The labelled circles correspond to the four PION components for each epoch (red for 2000 and blue for 2014) at their respective ionisation parameter values from Table 4. Bottom panel: thermal stability curve of electron temperature (Te) as a function of the pressure form of the ionisation parameter (Ξ). On the curve, the rate of cooling equals the rate of heating. Left of the curve, cooling dominates over heating and to the right, heating dominates over cooling. The labelled circles correspond to the Ξ values of the four PION components for each epoch: red for 2000 and blue for 2014.
Current usage metrics show cumulative count of Article Views (full-text article views including HTML views, PDF and ePub downloads, according to the available data) and Abstracts Views on Vision4Press platform.
Data correspond to usage on the plateform after 2015. The current usage metrics is available 48-96 hours after online publication and is updated daily on week days.
Initial download of the metrics may take a while.