Fig. 9.
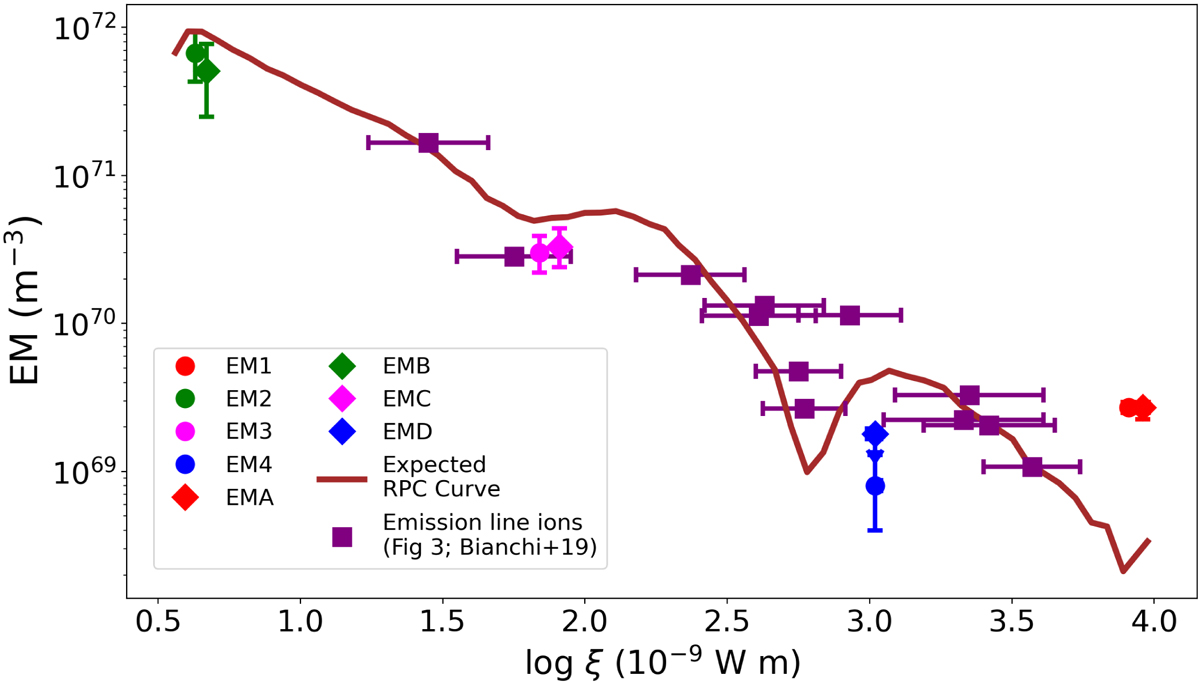
Emission measure (EM) of the four PION components in each epoch plotted versus their respective ionisation parameter (log ξ). The purple squares are the ions from Fig. 3 in Bianchi et al. (2019), whereby the EM values decrease for increasing log ξ, consistent with the PION components (same colours and data point styles from Fig. 7). We also plot the expected radiative pressure compression (RPC) curve (brown line) that follows the trend of both the ions (purple squares) and PION components suggesting that the photoionised plasma within NGC 1068 is consistent with RPC gas.
Current usage metrics show cumulative count of Article Views (full-text article views including HTML views, PDF and ePub downloads, according to the available data) and Abstracts Views on Vision4Press platform.
Data correspond to usage on the plateform after 2015. The current usage metrics is available 48-96 hours after online publication and is updated daily on week days.
Initial download of the metrics may take a while.