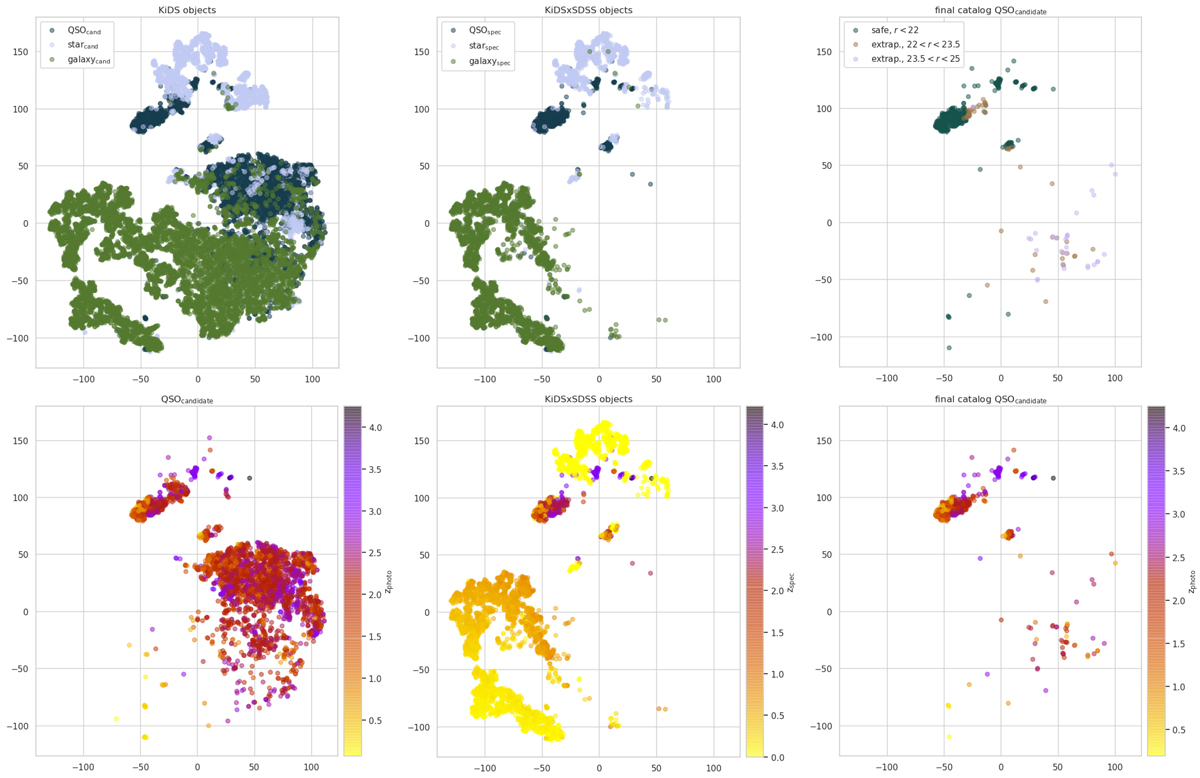
Fig. 12.

t-SNE projections. Top: classification. Bottom: redshifts. Left: raw output from the ML models for all the inference subsets. Center: spectroscopic SDSS distributions. Right: final QSO catalog at progressing magnitudes with the corresponding probability cuts, excluding the unsafe inference. The visualizations were made on a subset of 12k objects, thus actual object density at any part of the feature space is 3.8k times higher.
Current usage metrics show cumulative count of Article Views (full-text article views including HTML views, PDF and ePub downloads, according to the available data) and Abstracts Views on Vision4Press platform.
Data correspond to usage on the plateform after 2015. The current usage metrics is available 48-96 hours after online publication and is updated daily on week days.
Initial download of the metrics may take a while.


