Fig. 2.
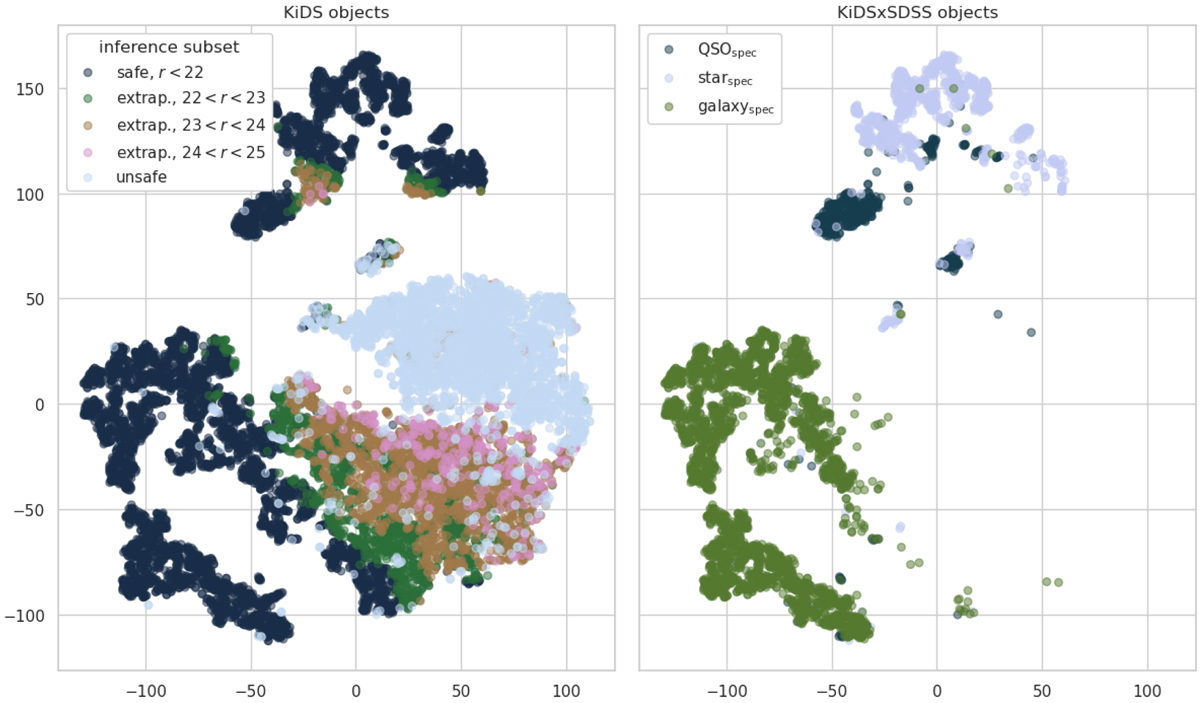
t-SNE projections. Left: inference subsets. Right: SDSS spectroscopic classification. The visualizations were made on subsets of 12k objects. The real density of objects at any part of the feature space is 3.8k times higher than visualized. We can see three main groups. The point-like objects cover the top part, extended ones are located at the bottom, and those with undetermined morphology are placed in the middle, in the unsafe subset. The spectroscopic data cover only the bright part of the photometric data; this illustrates the extrapolation problem to address with machine learning. The results of the inference are later investigated on similar plots (Sect. 3.3), which we consider a more robust approach than investigating color-color diagrams.
Current usage metrics show cumulative count of Article Views (full-text article views including HTML views, PDF and ePub downloads, according to the available data) and Abstracts Views on Vision4Press platform.
Data correspond to usage on the plateform after 2015. The current usage metrics is available 48-96 hours after online publication and is updated daily on week days.
Initial download of the metrics may take a while.