Fig. 6.
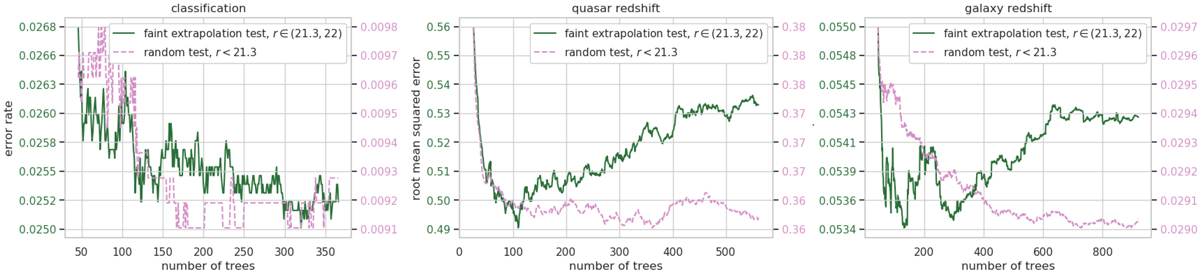
Learning histories for the XGB models. Left: classification. Center: QSO redshift. Right: galaxy redshift. The x-axis shows the number of trees created iteratively during the model training, and the y-axis shows the classification error rate and redshift root mean square error on two different scales for the random and faint extrapolation tests. The errors in the faint test are higher than in the random tests due to extrapolation and higher noise. The models were stopped if the results on the faint test did not improve for 200 consecutive trees. For classification, which is easier to solve than redshift regression, the random test shows minimums sooner, followed by oscillations, while the faint test suggests longer training. For redshifts, which is a more complicated problem, the faint test achieves minimum quickly and then shows overfitting, while the random test suggests longer training.
Current usage metrics show cumulative count of Article Views (full-text article views including HTML views, PDF and ePub downloads, according to the available data) and Abstracts Views on Vision4Press platform.
Data correspond to usage on the plateform after 2015. The current usage metrics is available 48-96 hours after online publication and is updated daily on week days.
Initial download of the metrics may take a while.