Fig. 15
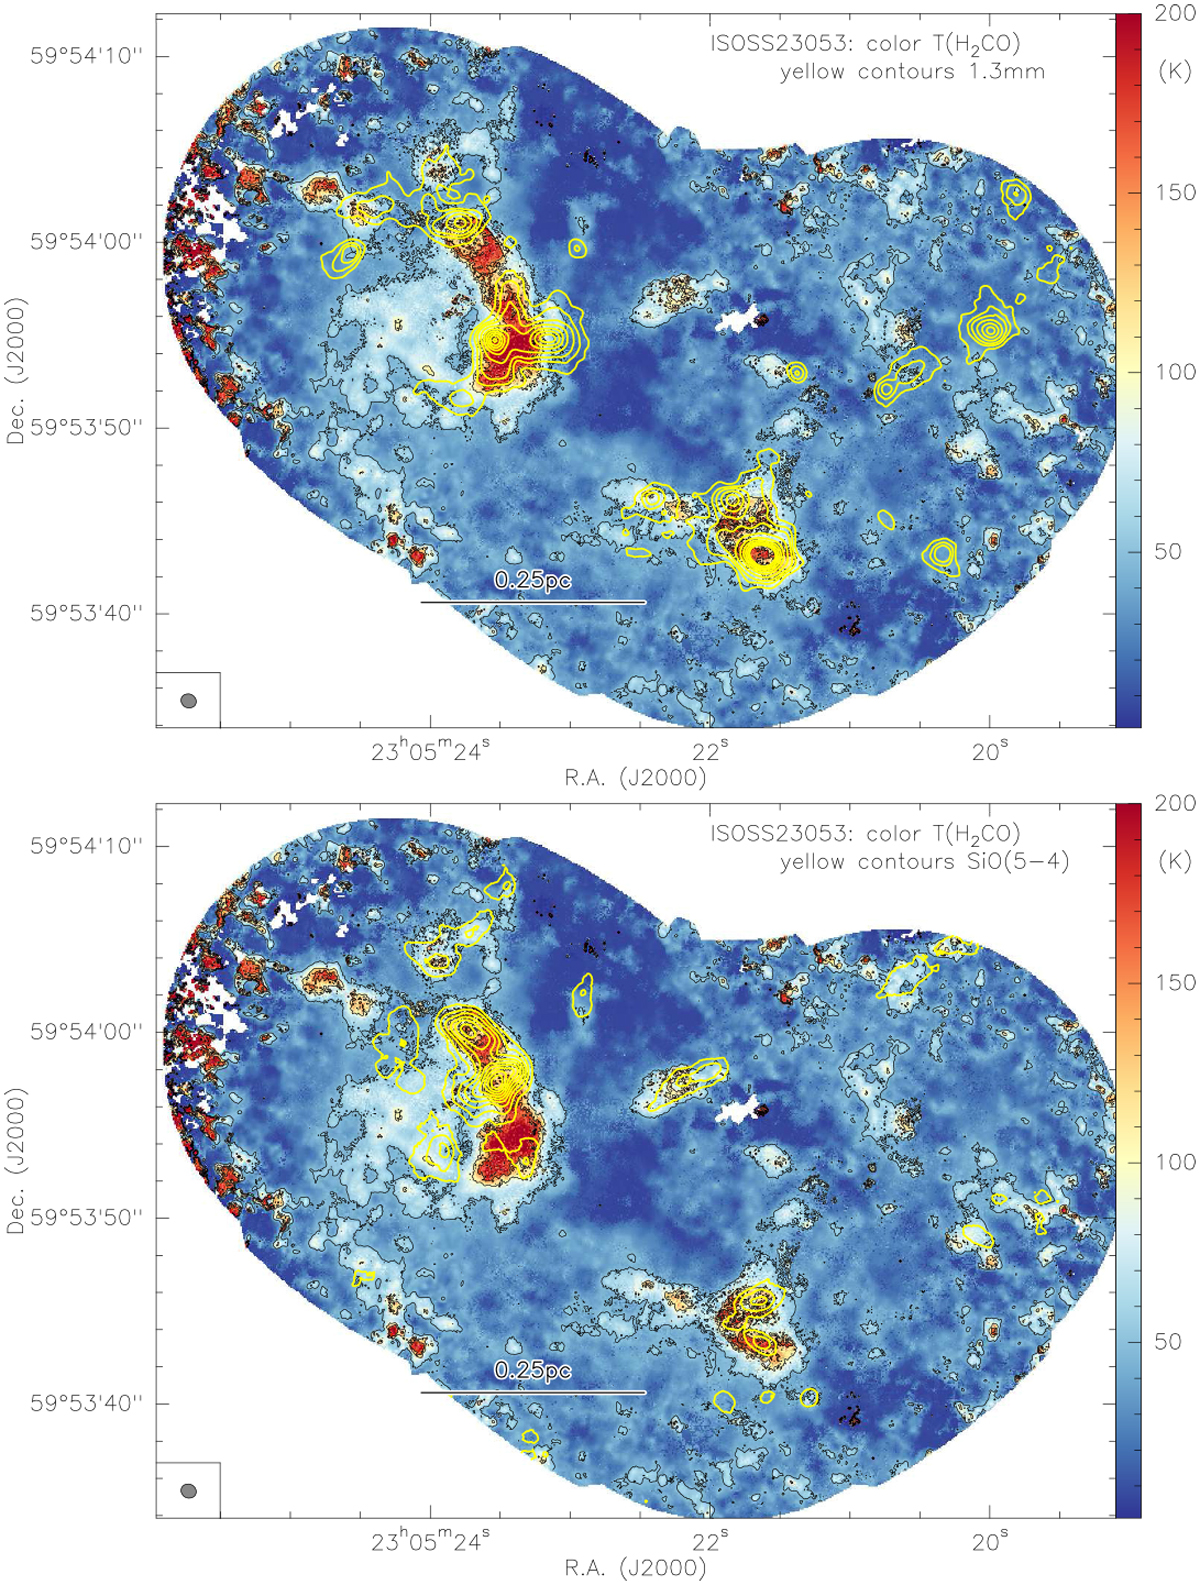
Temperature map for ISOSS23053 derived from the H2CO line emission. Both panels show, in color scale, the derived temperatures with black contour levels of 50, 100, and 150 K. The high temperatures in particular at the eastern edge of the map are not real but are caused by the lower signal-to-noise ratio there. The yellow contours in the top and bottom panelspresent the 1.3 mm continuum and the integrated SiO(5–4) emission, respectively. The 1.3 mm continuum contours are in 3σ steps (1σ ~ 0.16 mJy beam−1). The SiO emission is integrated from −61 to −43 km s−1 clipping all data below an approximate 4σ threshold of 20 mJy beam−1. Contour levels are from 10 to 90% (step 10%) of the integrated peak emission of 1.58 Jy beam−1 km s−1. The beam isshown in the bottom-left of each panel, and a linear scale bar is shown as well.
Current usage metrics show cumulative count of Article Views (full-text article views including HTML views, PDF and ePub downloads, according to the available data) and Abstracts Views on Vision4Press platform.
Data correspond to usage on the plateform after 2015. The current usage metrics is available 48-96 hours after online publication and is updated daily on week days.
Initial download of the metrics may take a while.