Fig. 16
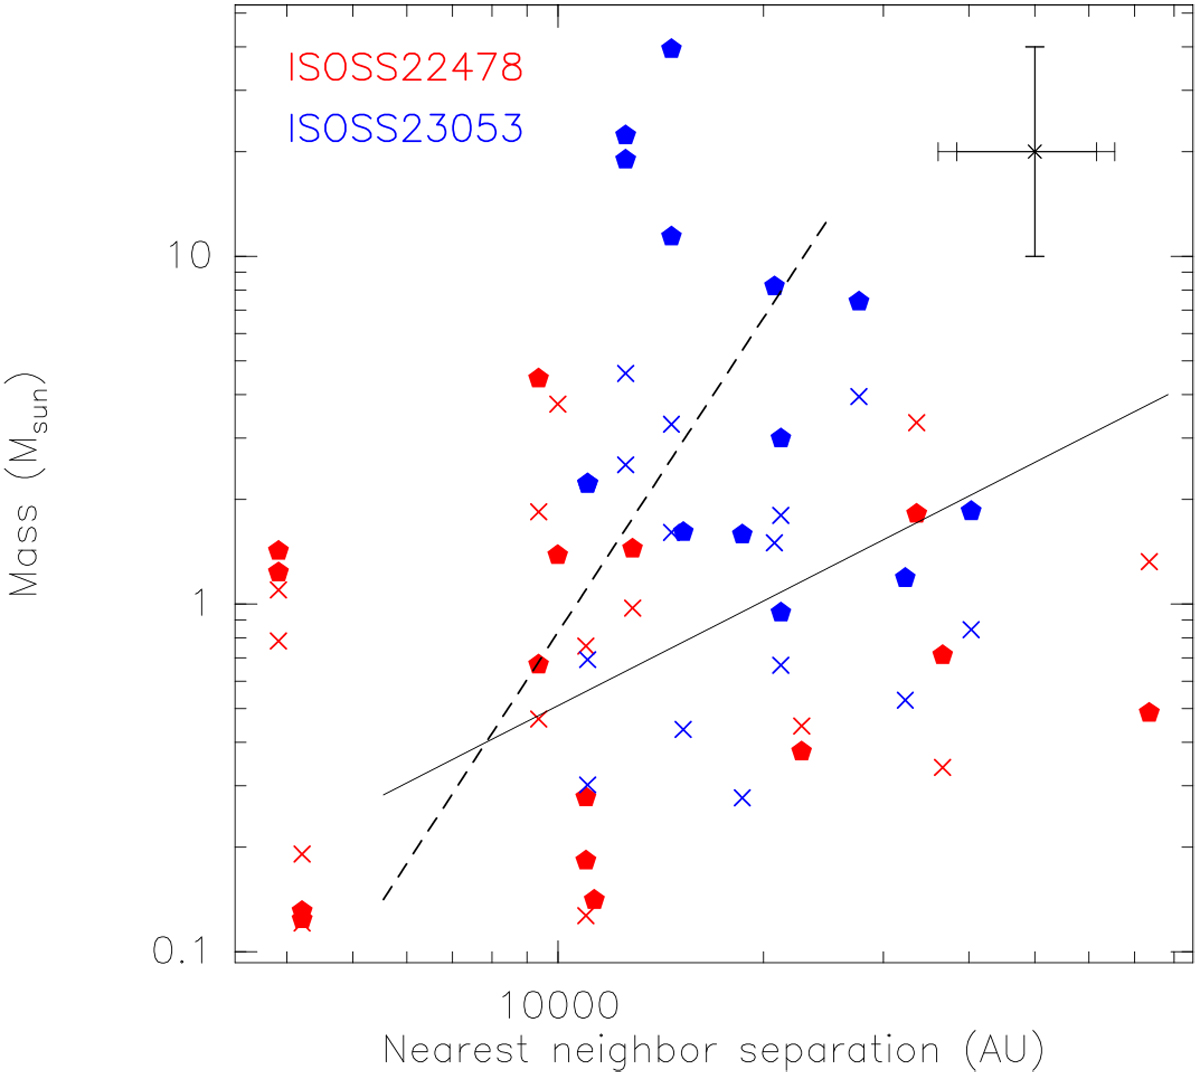
Core masses against nearest-neighbor separations from the minimum spanning tree analysis. The full pentagons show the results estimated assuming constant temperatures (T20 K) whereas the crosses present the data assuming the temperatures derived from the H2CO line data (![]() ). The full line corresponds to the Jeans lengths and Jeans masses calculated at 20 K for a density grid between
5 × 10³ and 106 cm−3. For comparison, the dashed line corresponds to the Jeans lengths and Jeans masses calculated at a fixed density of
5 × 105 cm−3
with temperatures between 10 and 200 K. The error-bars in the top-right correspond to a factor 2 uncertainty for masses and 1 kpc distance uncertainty for the nearest-neighbor separations (resulting in the different error-bar end markers for the separations).
). The full line corresponds to the Jeans lengths and Jeans masses calculated at 20 K for a density grid between
5 × 10³ and 106 cm−3. For comparison, the dashed line corresponds to the Jeans lengths and Jeans masses calculated at a fixed density of
5 × 105 cm−3
with temperatures between 10 and 200 K. The error-bars in the top-right correspond to a factor 2 uncertainty for masses and 1 kpc distance uncertainty for the nearest-neighbor separations (resulting in the different error-bar end markers for the separations).
Current usage metrics show cumulative count of Article Views (full-text article views including HTML views, PDF and ePub downloads, according to the available data) and Abstracts Views on Vision4Press platform.
Data correspond to usage on the plateform after 2015. The current usage metrics is available 48-96 hours after online publication and is updated daily on week days.
Initial download of the metrics may take a while.