Fig. 7
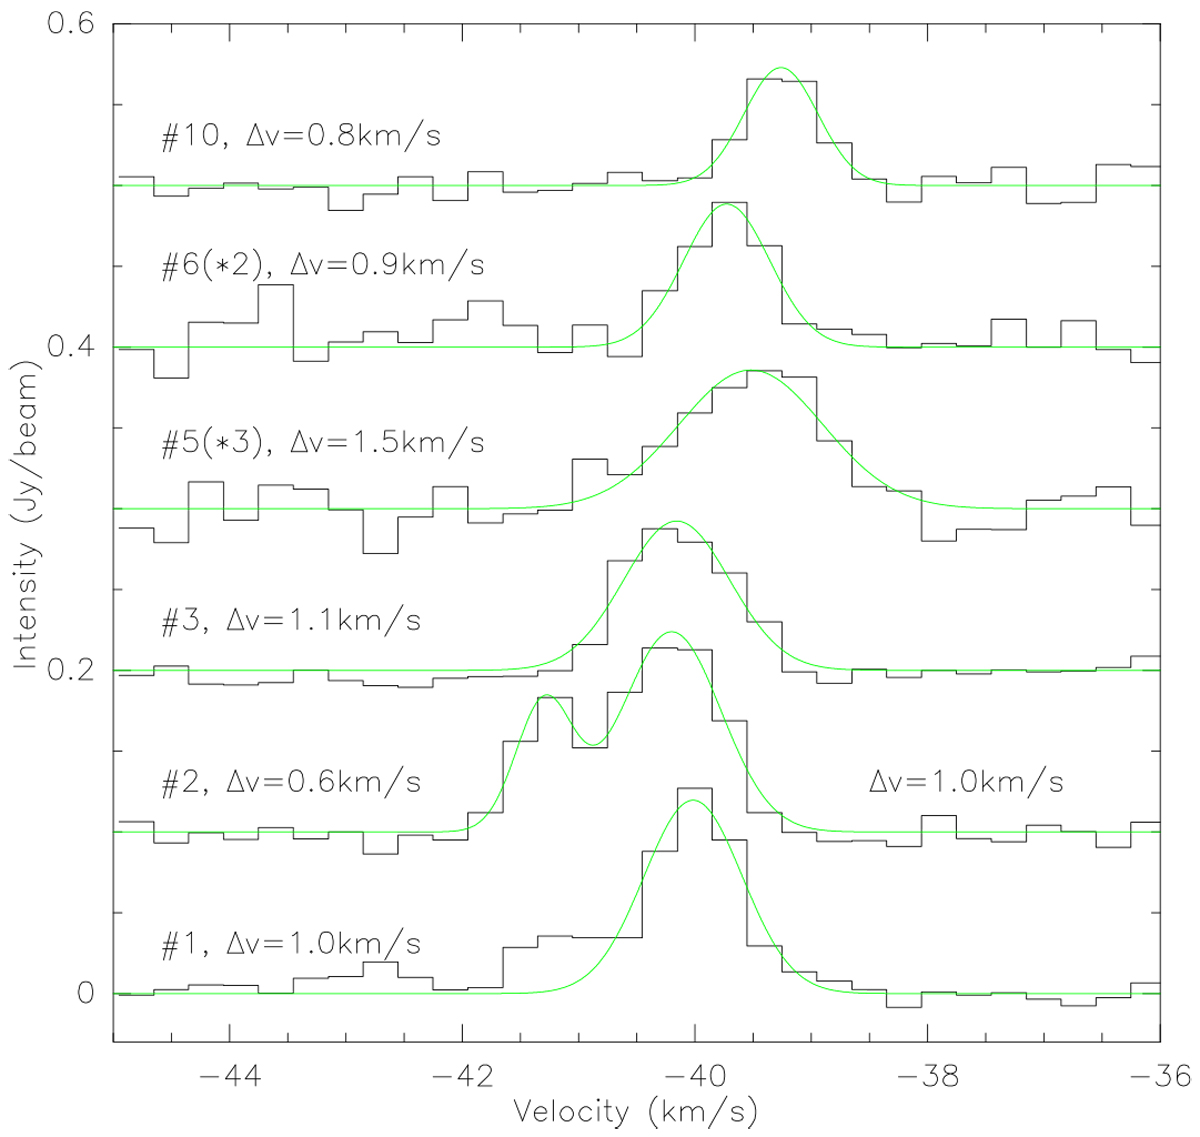
DCO+(3–2) example spectra toward the labeled core positions in ISOSS22478 (Fig. 3). The spectra are shifted on the Y-axis for better presentation. The spectra of core #5 and core #6 are multiplied by 3 and 2 for clarity. The green lines show Gaussian fits, the FWHM linewidth Δv are presented for all spectra. For core #2, two components were fitted.
Current usage metrics show cumulative count of Article Views (full-text article views including HTML views, PDF and ePub downloads, according to the available data) and Abstracts Views on Vision4Press platform.
Data correspond to usage on the plateform after 2015. The current usage metrics is available 48-96 hours after online publication and is updated daily on week days.
Initial download of the metrics may take a while.