Fig. 11
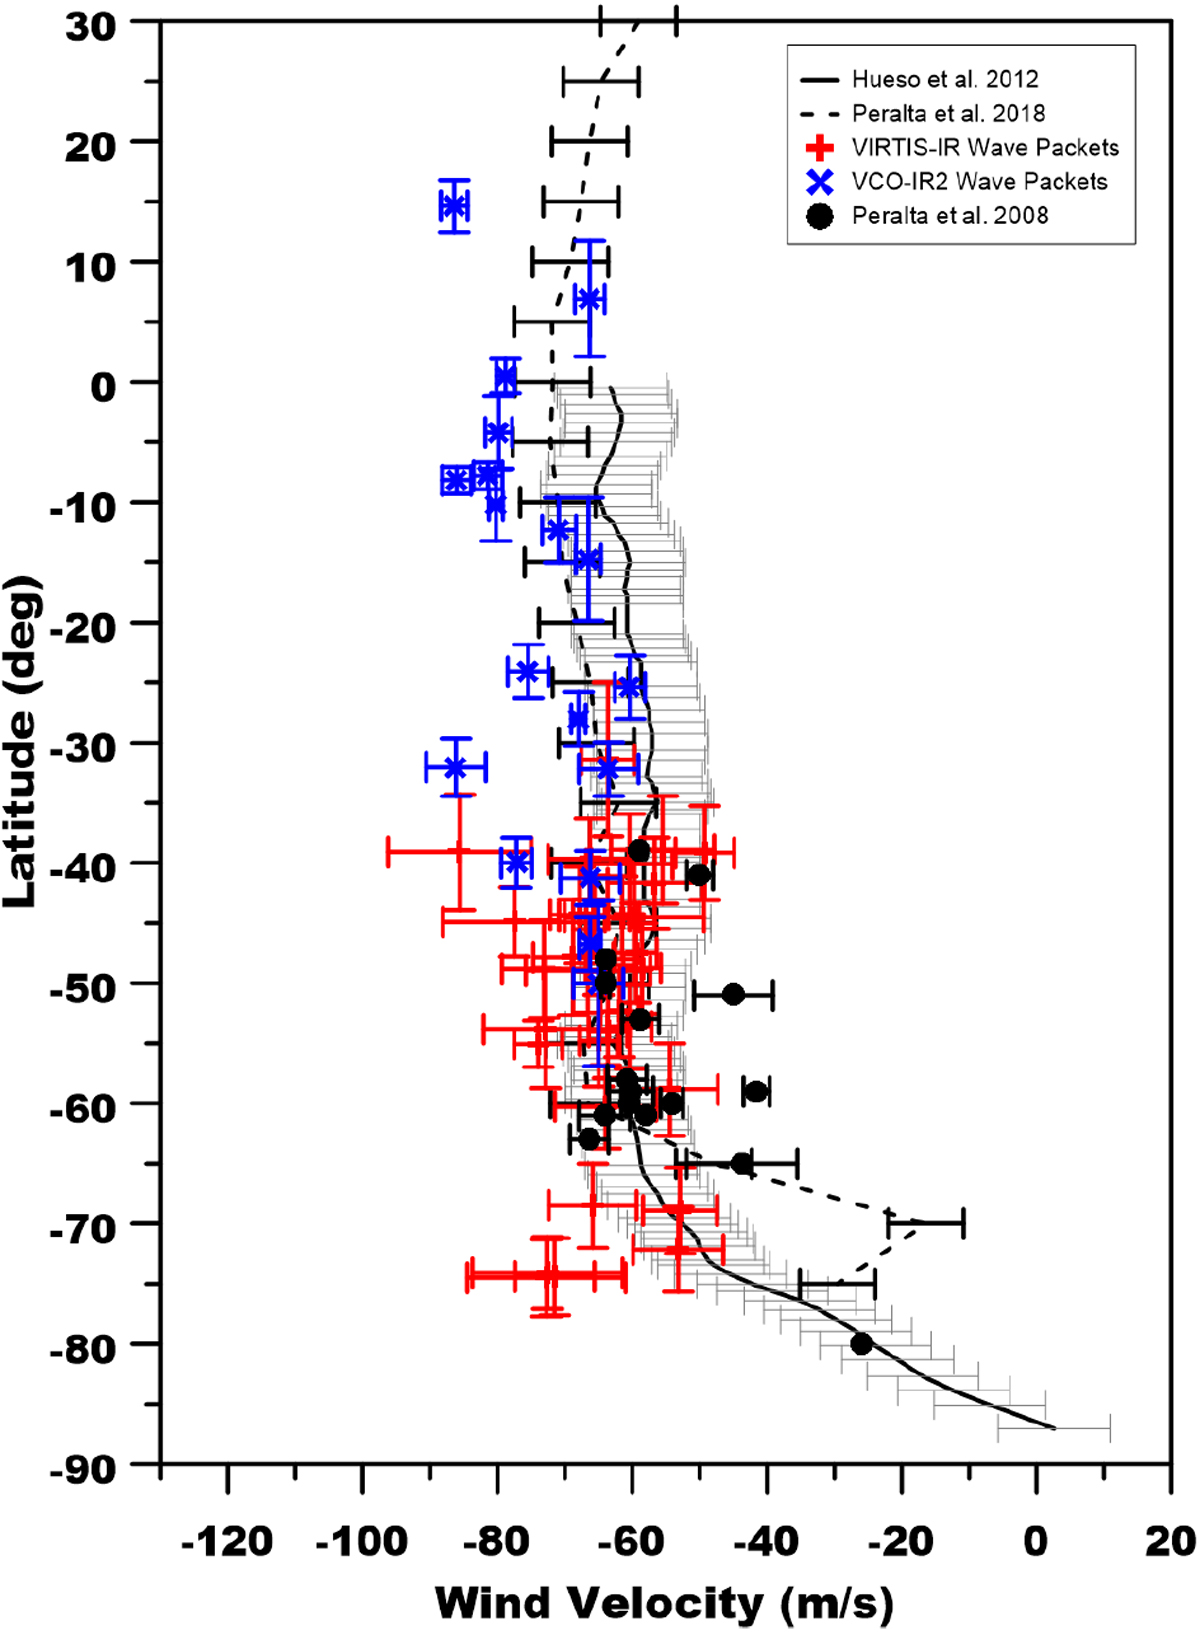
Zonal wind profile of Venus’ lower cloud and the measured phase velocity of characterised packets from VIRTIS and IR2 data. The filled and dashed profiles in black represent the wind profiles on the lower cloud reported in Hueso et al. (2012) and Peralta et al. (2018), respectively. Blue crosses (dark grey) and red plus signs (light grey) mark the absolute phase velocity of wave packets retrieved with IR2 and VIRTIS respectively along with data from Peralta et al. (2008).
Current usage metrics show cumulative count of Article Views (full-text article views including HTML views, PDF and ePub downloads, according to the available data) and Abstracts Views on Vision4Press platform.
Data correspond to usage on the plateform after 2015. The current usage metrics is available 48-96 hours after online publication and is updated daily on week days.
Initial download of the metrics may take a while.