Fig. 12
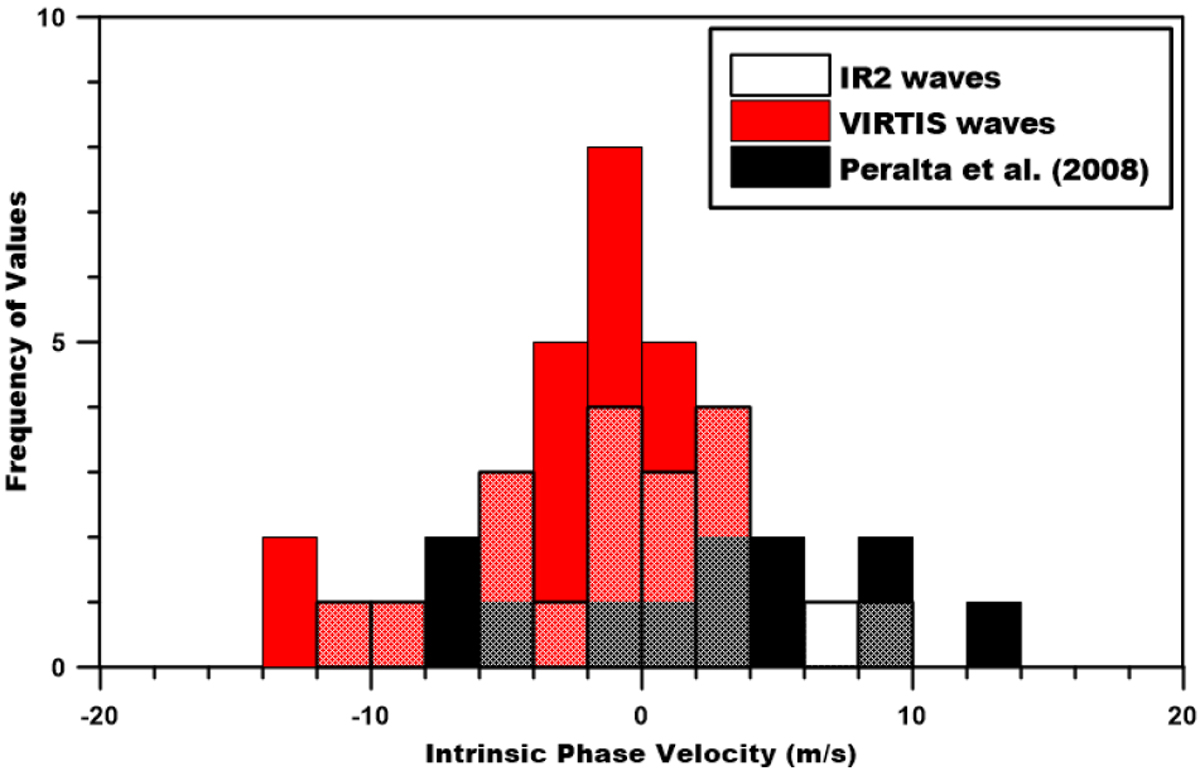
Histogram of intrinsic phase velocity of characterised packets. Bin size is 2 m s−1 and each value represents a different packet. Red (light grey) bins show values from VIRTIS data and overlaid on top with a semi-transparent pattern are values from IR2 data. Additionally, as black bins we show the data from Peralta et al. (2008).
Current usage metrics show cumulative count of Article Views (full-text article views including HTML views, PDF and ePub downloads, according to the available data) and Abstracts Views on Vision4Press platform.
Data correspond to usage on the plateform after 2015. The current usage metrics is available 48-96 hours after online publication and is updated daily on week days.
Initial download of the metrics may take a while.