Free Access
Fig. 13
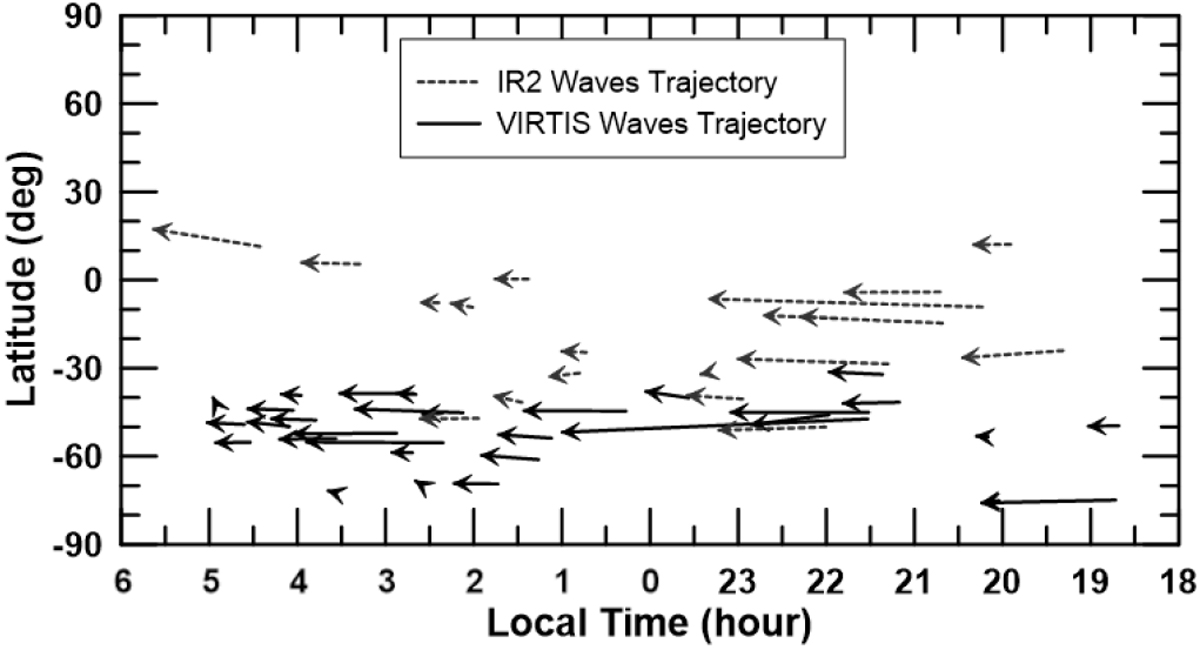
Trajectory of tracked wave packets from VIRTIS (filled line) and IR2 (dashed line) data on a latitude/local time map of the nightside of Venus. The length of the arrows represents the location of the first observation of the packet, following a straight trajectory to its last observed location.
Current usage metrics show cumulative count of Article Views (full-text article views including HTML views, PDF and ePub downloads, according to the available data) and Abstracts Views on Vision4Press platform.
Data correspond to usage on the plateform after 2015. The current usage metrics is available 48-96 hours after online publication and is updated daily on week days.
Initial download of the metrics may take a while.