Fig. 17
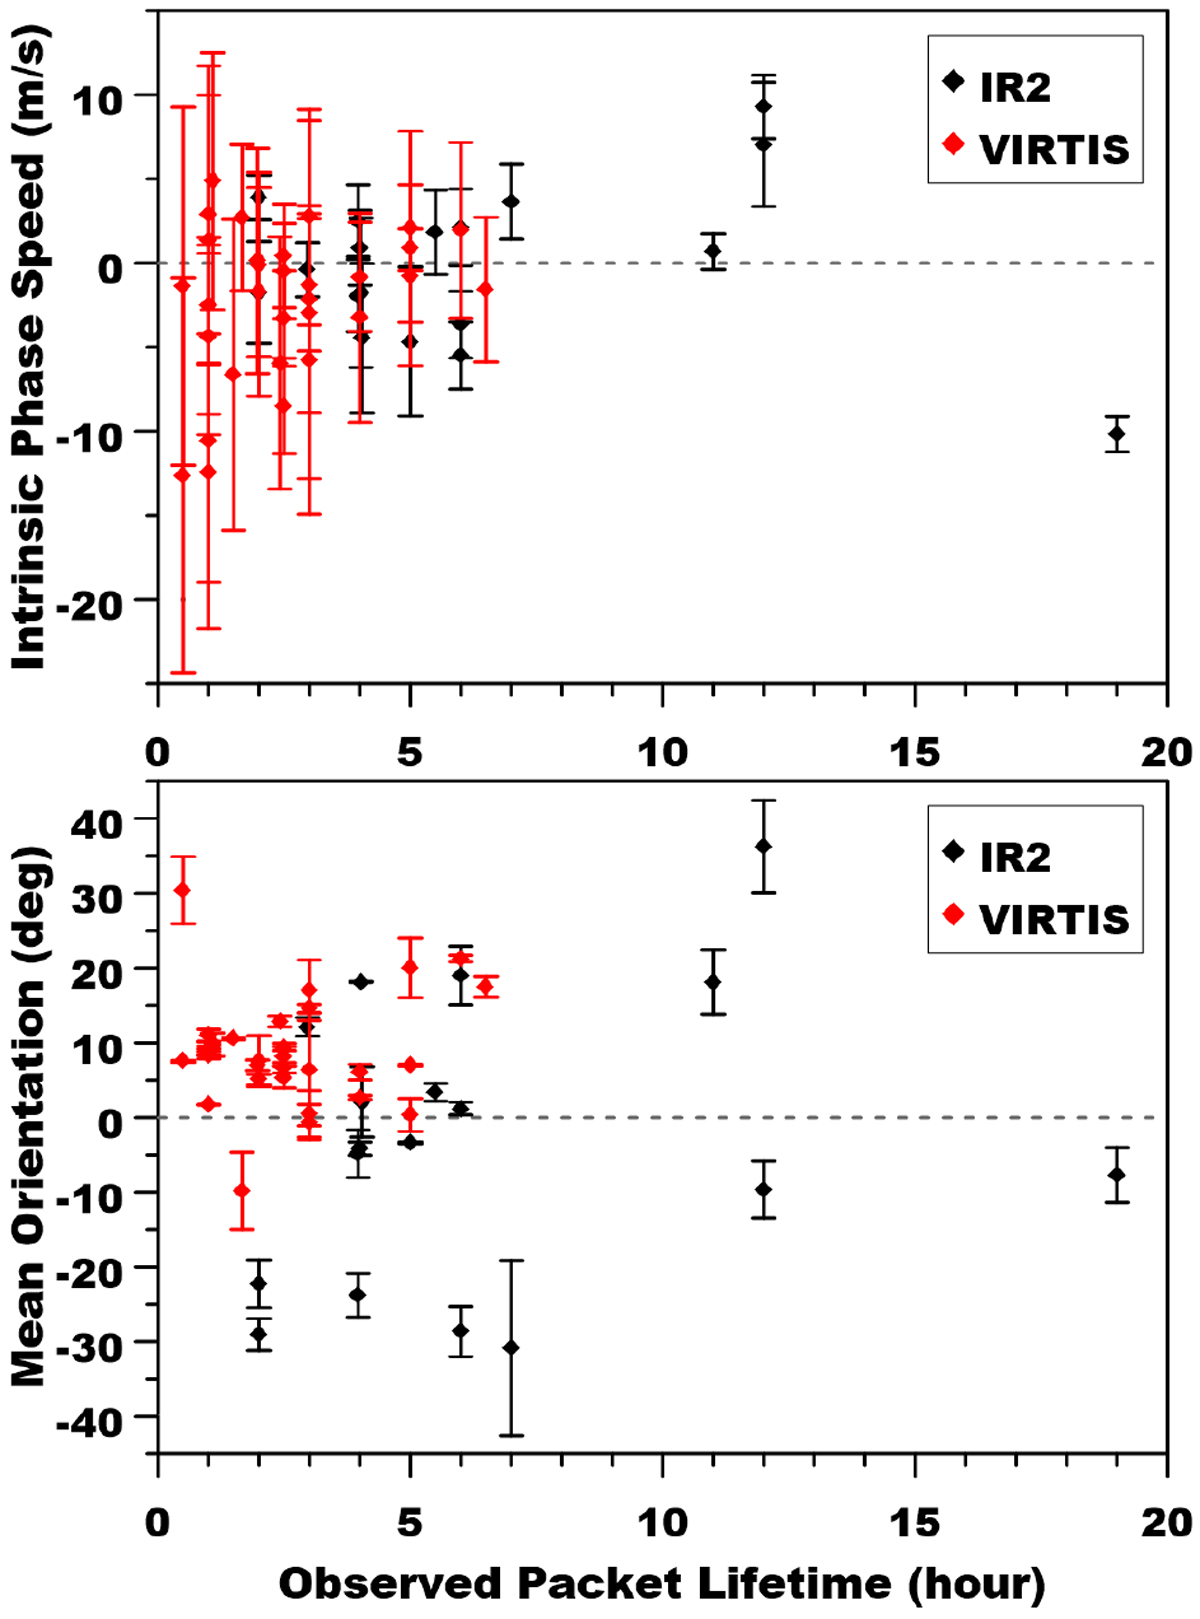
Observed lifetime of identified packets (whose dynamics are characterised herein) versus their intrinsic phase speed (top) and mean orientation (bottom). Each point represents a single packet. The error bars for intrinsic phase speed correspond to the velocity error, the calculation of which was performed with Eq. (9), while the error bars for orientation represent the standard deviation from the mean value between all orientation measurements for each specific packet.
Current usage metrics show cumulative count of Article Views (full-text article views including HTML views, PDF and ePub downloads, according to the available data) and Abstracts Views on Vision4Press platform.
Data correspond to usage on the plateform after 2015. The current usage metrics is available 48-96 hours after online publication and is updated daily on week days.
Initial download of the metrics may take a while.