Fig. 3
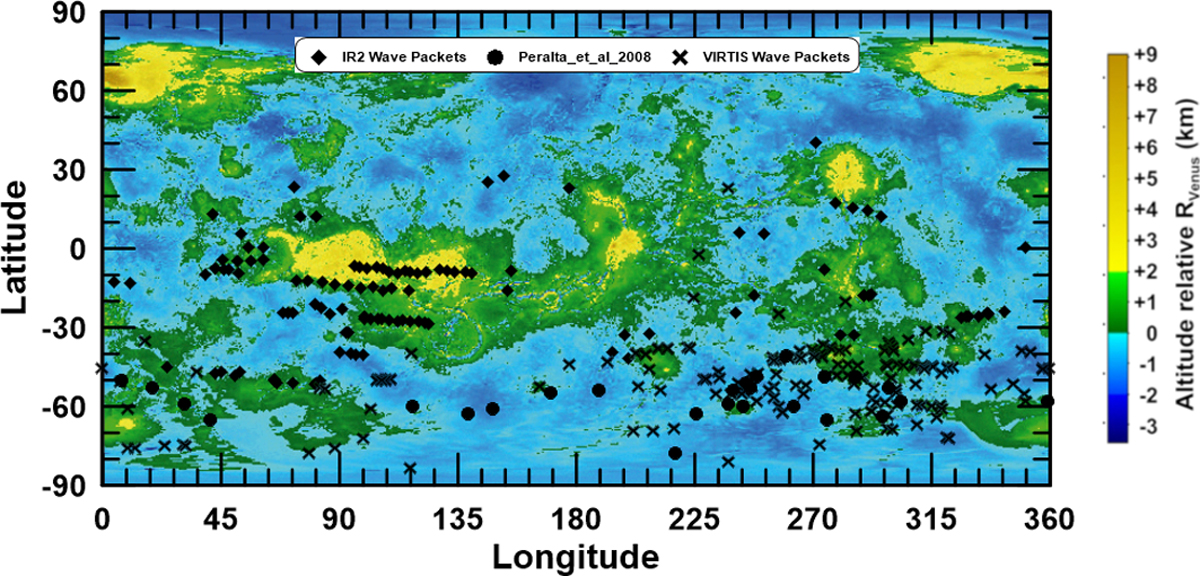
Distribution of characterised wave packets on the nightside of Venus during the period of observation. Wave packets from VIRTIS data are represented by crosses and from IR2 are represented by rhombuses. Additionally, represented by dark circles are wave packets featured in Peralta et al. (2008). The topography map was made from data from VeRa onboard Venus Express (Hausler et al. 2006, 2007).
Current usage metrics show cumulative count of Article Views (full-text article views including HTML views, PDF and ePub downloads, according to the available data) and Abstracts Views on Vision4Press platform.
Data correspond to usage on the plateform after 2015. The current usage metrics is available 48-96 hours after online publication and is updated daily on week days.
Initial download of the metrics may take a while.