Fig. 5
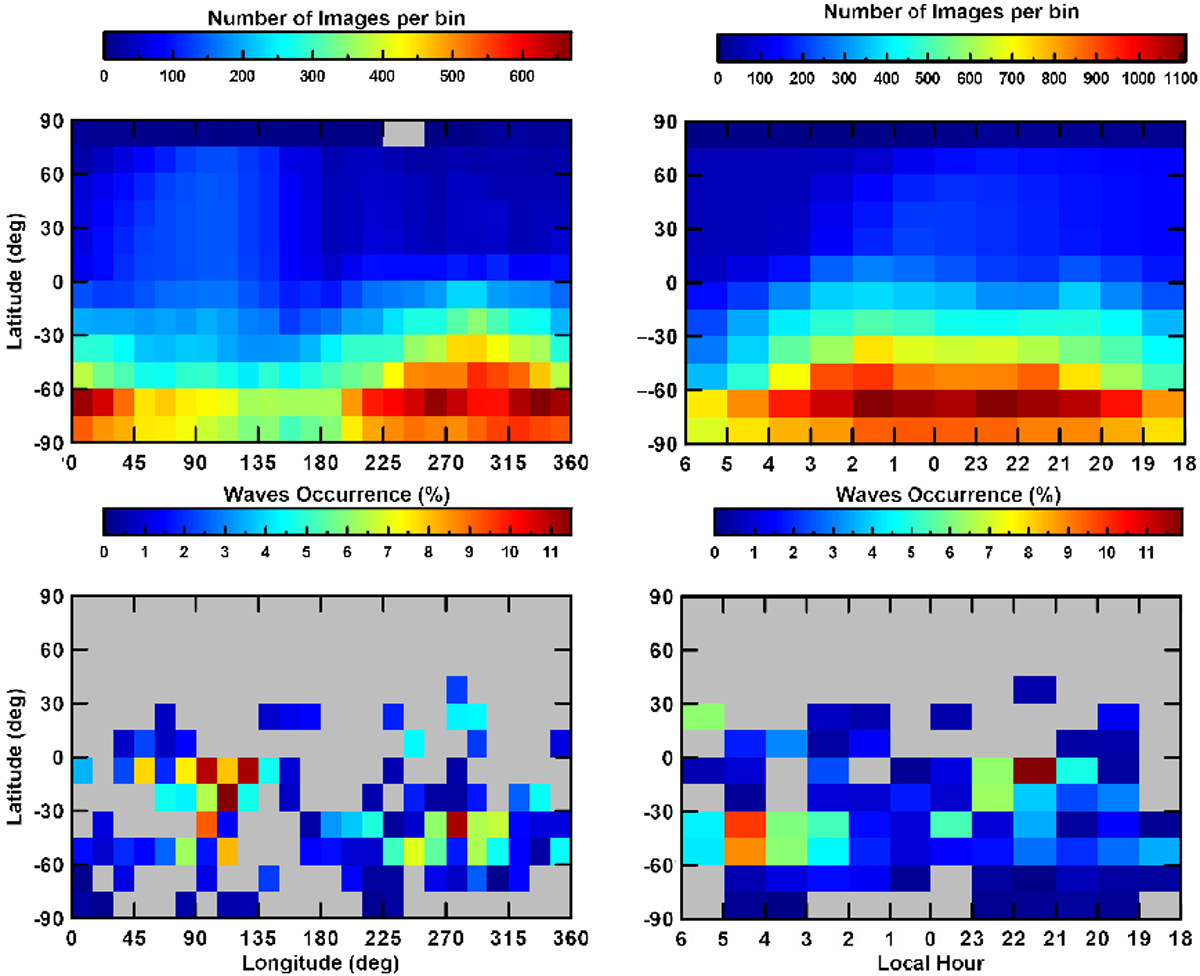
Top: latitude/longitude and latitude/local time coverage maps of VIRTIS and IR2 images during the period of observation for both datasets. A greater number of images are shown for the southern hemisphere, particularly in regions between 60° and 90°S at 0°–45° and 195°–360° and slightly decreasing between both terminators. Bottom: latitude/longitude and latitude/local time maps of the percentage of wave occurrence within the number of images analysed..
Current usage metrics show cumulative count of Article Views (full-text article views including HTML views, PDF and ePub downloads, according to the available data) and Abstracts Views on Vision4Press platform.
Data correspond to usage on the plateform after 2015. The current usage metrics is available 48-96 hours after online publication and is updated daily on week days.
Initial download of the metrics may take a while.