Fig. 8
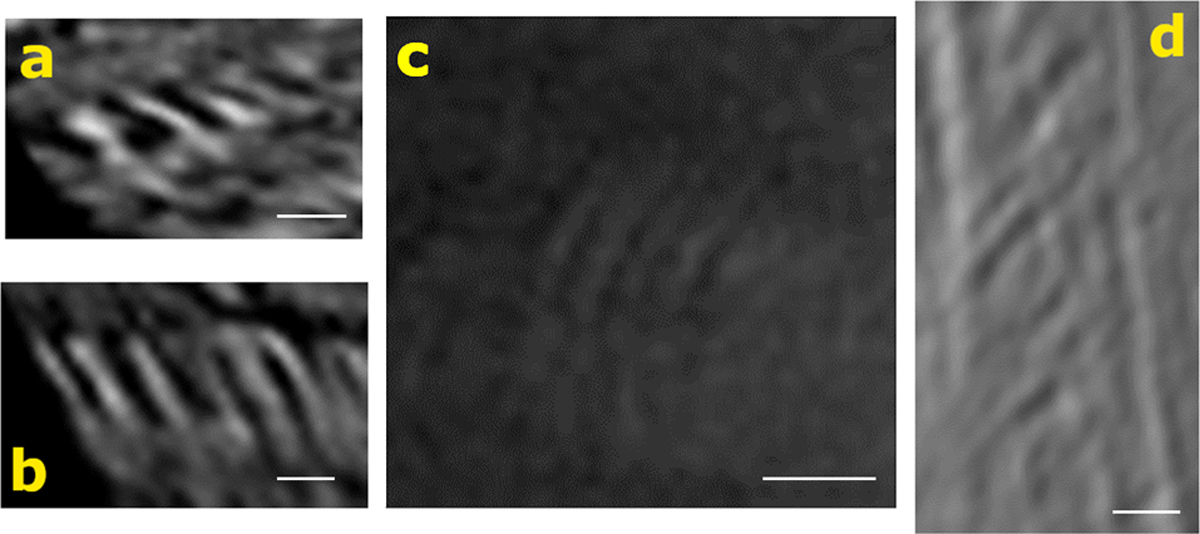
Examples of wave packets characterised with VIRTIS and IR2. The two images on the left (a(VI0834_04), b(VI0607_07)) show the crests and troughs very clearly, with a sharp contrast in comparison to the background atmosphere. The two images on the right (c(ir2_20160905_033333_226_l2b_v10), d(VI0588_05)) show that the boundary for the width of each different crest is not as clear. The white bars on each image represent a distance of 100 Km.
Current usage metrics show cumulative count of Article Views (full-text article views including HTML views, PDF and ePub downloads, according to the available data) and Abstracts Views on Vision4Press platform.
Data correspond to usage on the plateform after 2015. The current usage metrics is available 48-96 hours after online publication and is updated daily on week days.
Initial download of the metrics may take a while.