Free Access
Fig. 9
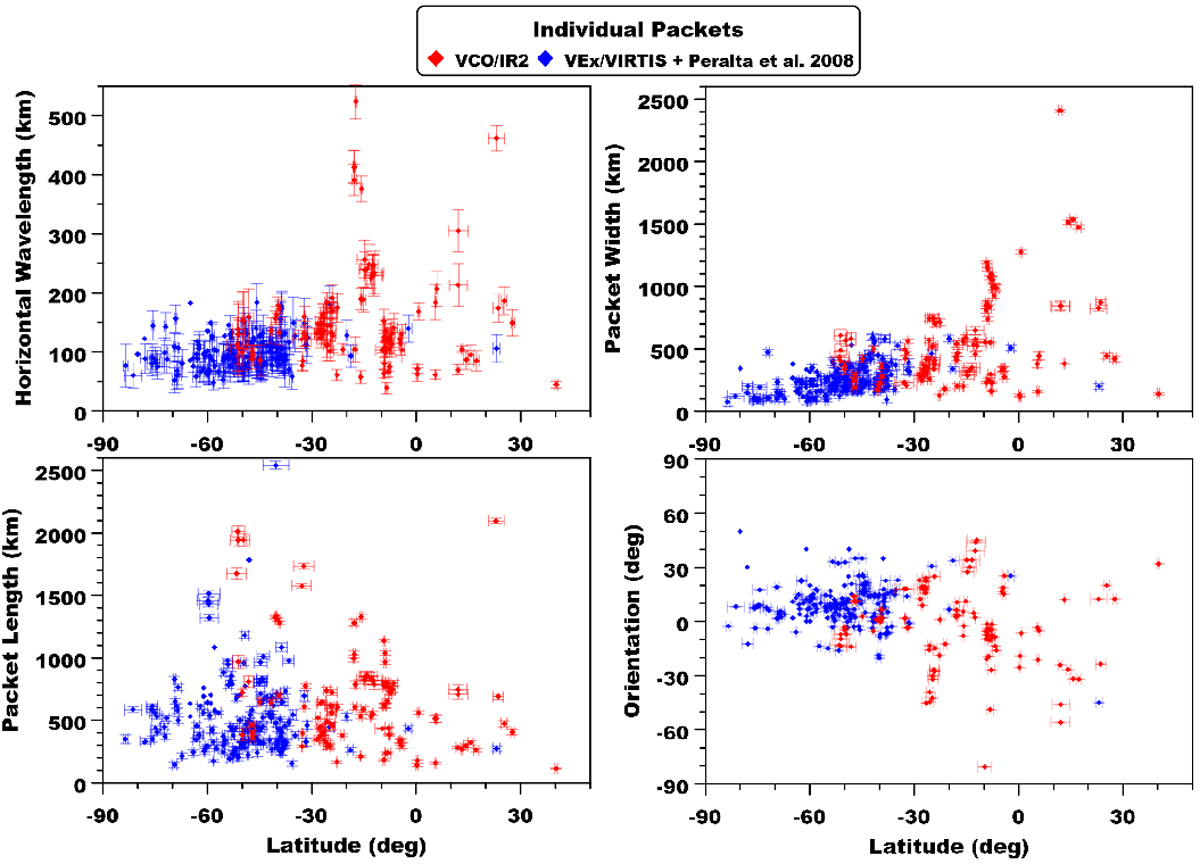
Distribution of morphological properties of waves with their respective latitude. Each plot point represents a wave packet detected with VIRTIS (blue or dark grey) or IR2 (red or light grey).
Current usage metrics show cumulative count of Article Views (full-text article views including HTML views, PDF and ePub downloads, according to the available data) and Abstracts Views on Vision4Press platform.
Data correspond to usage on the plateform after 2015. The current usage metrics is available 48-96 hours after online publication and is updated daily on week days.
Initial download of the metrics may take a while.