Free Access
Fig. 11
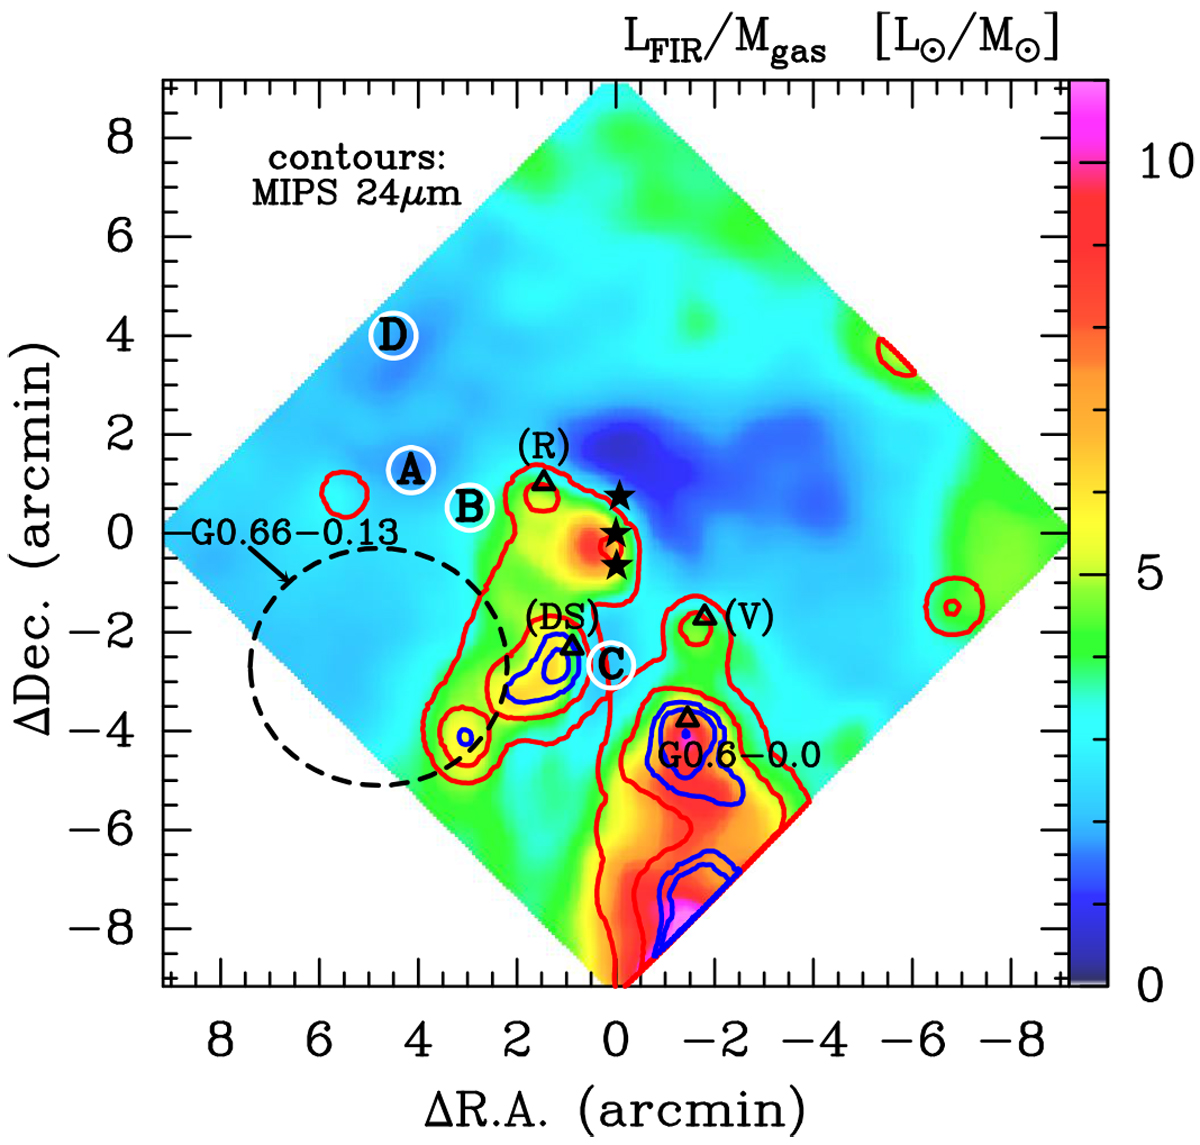
Map of the FIR-luminosity to gas-mass ratio LFIR / Mgas in units of L⊙ / M⊙ per pixel (at an angular resolution of 42″). Contours represent 24 μm emission levels from 3 × 10⁴ MJy sr−1 (red) to 200 MJy sr−1 (blue).
Current usage metrics show cumulative count of Article Views (full-text article views including HTML views, PDF and ePub downloads, according to the available data) and Abstracts Views on Vision4Press platform.
Data correspond to usage on the plateform after 2015. The current usage metrics is available 48-96 hours after online publication and is updated daily on week days.
Initial download of the metrics may take a while.