Free Access
Fig. 4.
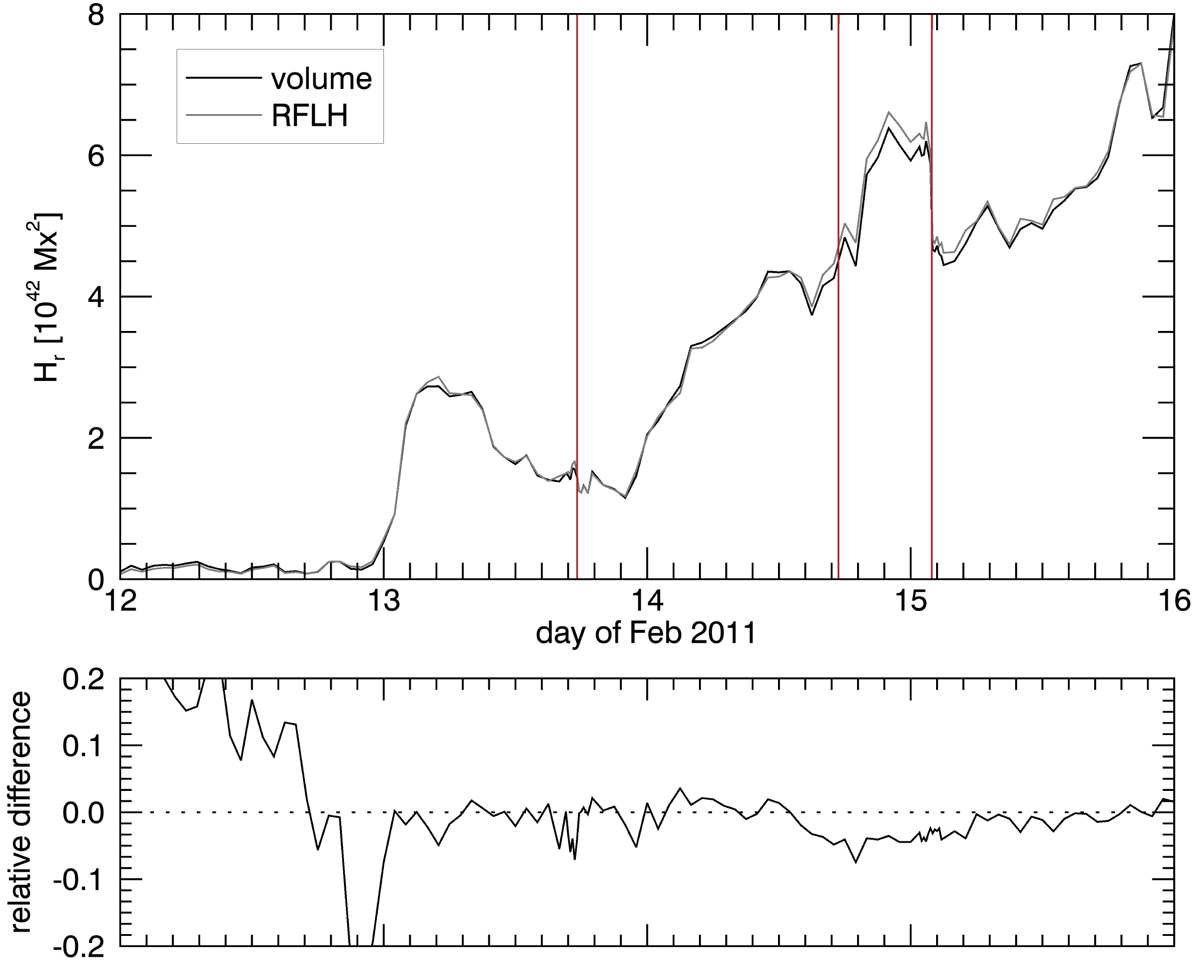
Evolution of relative helicity in AR 11158 as calculated by the volume (Eq. (1), black line), and the RFLH methods (Eq. (6), grey line) in the top panel, and of their relative difference in the bottom, during the whole studied interval. The vertical lines denote the times of the two M- and of the X-class flares.
Current usage metrics show cumulative count of Article Views (full-text article views including HTML views, PDF and ePub downloads, according to the available data) and Abstracts Views on Vision4Press platform.
Data correspond to usage on the plateform after 2015. The current usage metrics is available 48-96 hours after online publication and is updated daily on week days.
Initial download of the metrics may take a while.