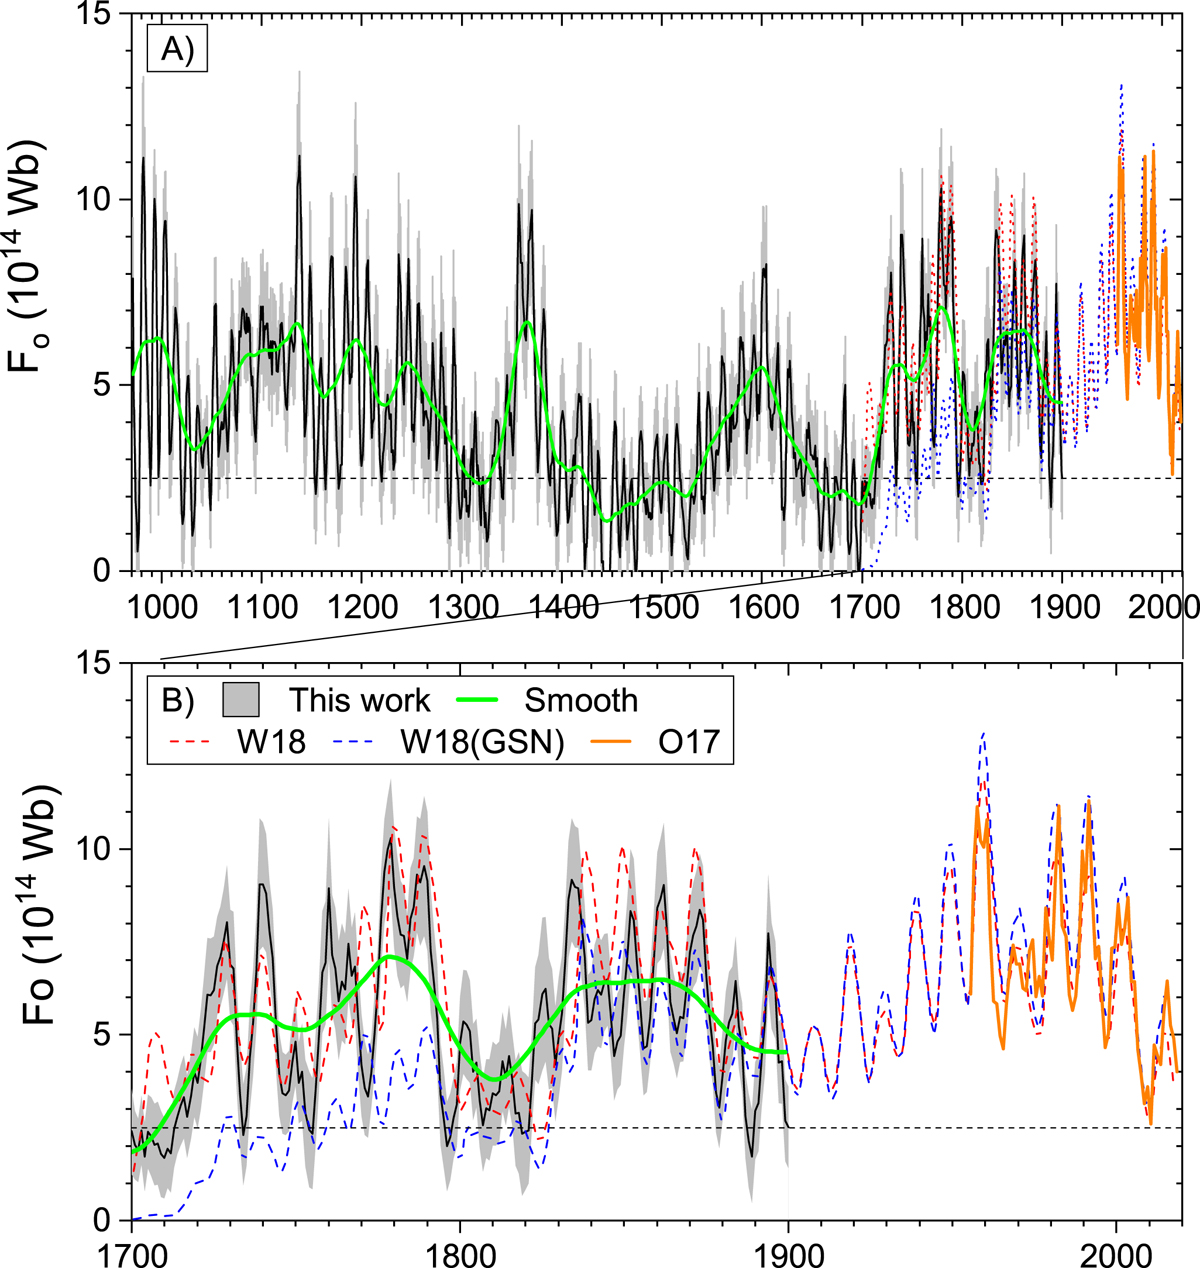
Fig. 8.

Evolution of the reconstructed annual Fo. The mean curve (black) and 1σ uncertainties (grey shaded area) were computed by 10 000 MC realisations (see text). The green curve represents the smoothed (22-yr SSA) variability. The mean level of 2.5 ⋅ 1014 Wb defines the grand minima when solar magnetic activity drops below the sunspot formation threshold. Other reconstructions are shown for comparison: that of Wu et al. (2018a, W18) based on the SATIRE-T model applied to ISN (v.2); the same SATIRE-T model but applied to the GSN (W18(GSN)), as well as the OSF reconstructed from space-based measurements (Owens et al. 2017, – O17). Panel B: zoom to the period after 1700. The data are available at the CDS.
Current usage metrics show cumulative count of Article Views (full-text article views including HTML views, PDF and ePub downloads, according to the available data) and Abstracts Views on Vision4Press platform.
Data correspond to usage on the plateform after 2015. The current usage metrics is available 48-96 hours after online publication and is updated daily on week days.
Initial download of the metrics may take a while.


