Fig. 2
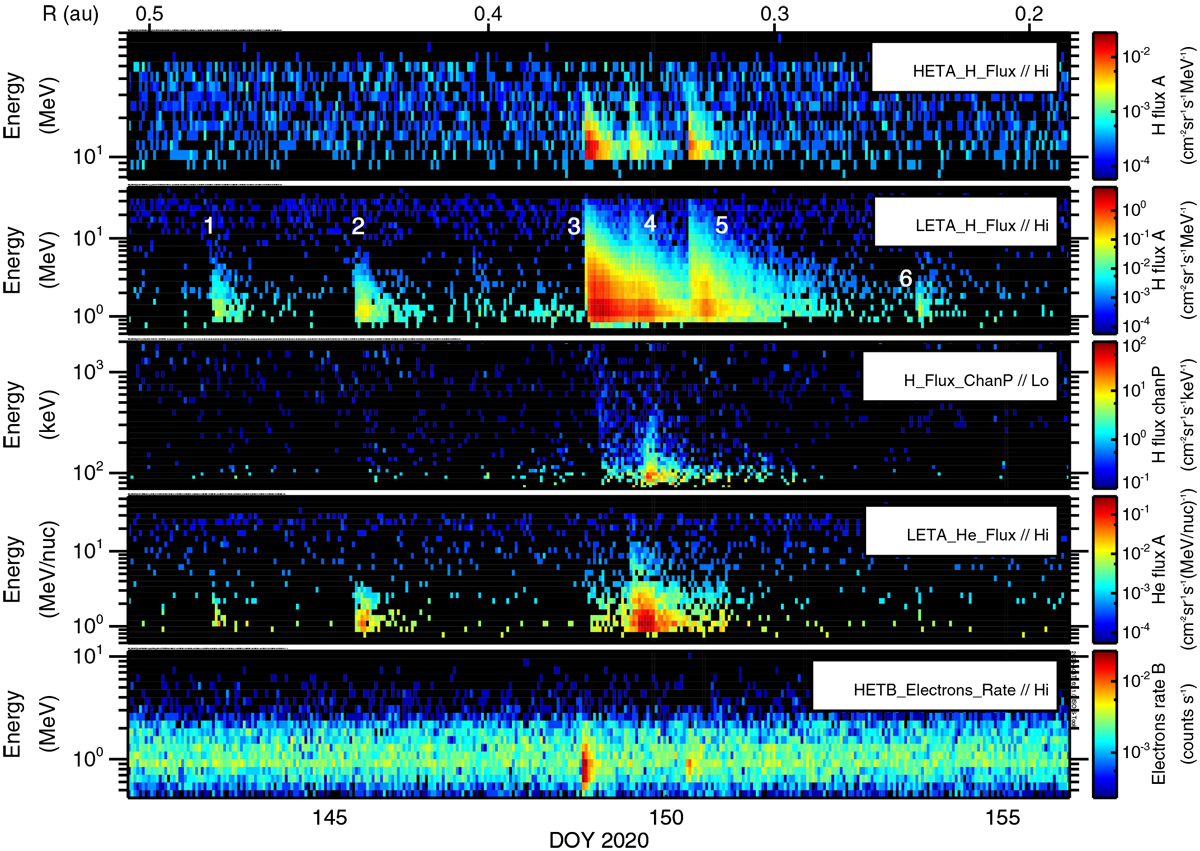
Spectrograms showing the proton intensity versus energy and time from HETA (top panel), LETA (second panel), and EPI-Lo (third panel); the helium intensity from LETA (fourth panel); and the electron count rate from HETB (bottom panel). Event numbers are given at the top of the second panel.
Current usage metrics show cumulative count of Article Views (full-text article views including HTML views, PDF and ePub downloads, according to the available data) and Abstracts Views on Vision4Press platform.
Data correspond to usage on the plateform after 2015. The current usage metrics is available 48-96 hours after online publication and is updated daily on week days.
Initial download of the metrics may take a while.