Fig. 3
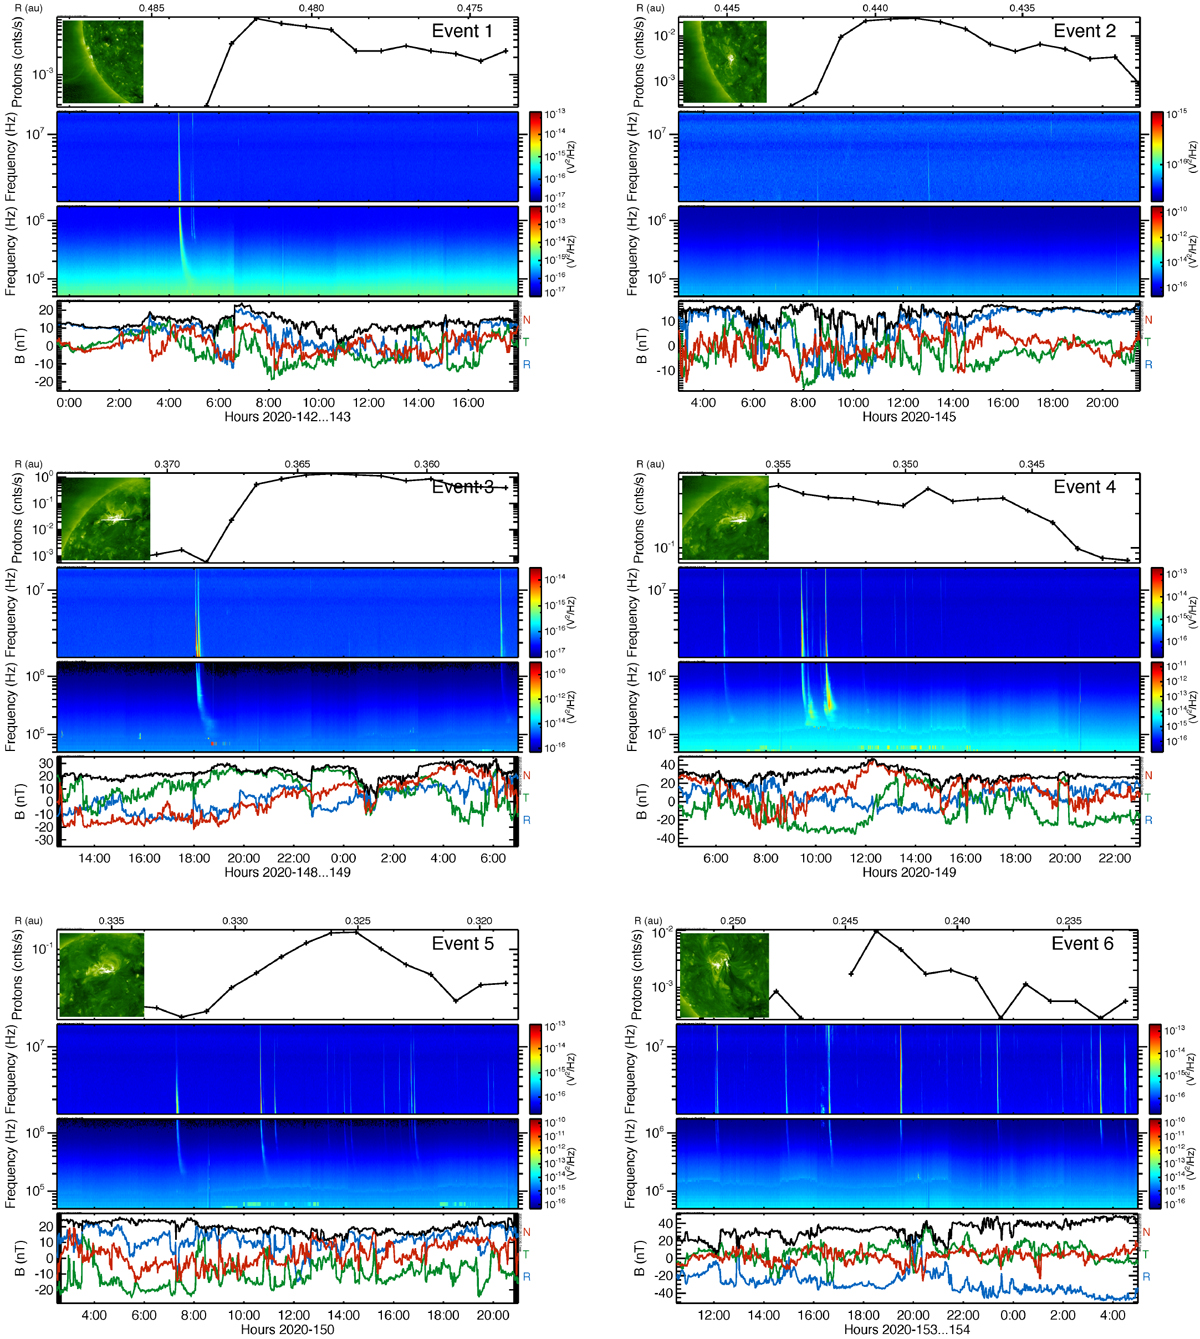
Onsets of the six events showing the hourly LETA range 1 proton rate in the top panels, the HFR and LFR radio data (second and third panels), and the magnetic field magnitude (black trace) and R (blue trace), T (green trace), N (red trace) components (bottom panels). Insets in the upper panels of each event show the solar source region during the related eruption as seen in STEREO-A/EUVI. The images were treated with a wavelet-based algorithm (Stenborg et al. 2008)to enhance the off-limb emission; full movies of the eruptions are available online.
Current usage metrics show cumulative count of Article Views (full-text article views including HTML views, PDF and ePub downloads, according to the available data) and Abstracts Views on Vision4Press platform.
Data correspond to usage on the plateform after 2015. The current usage metrics is available 48-96 hours after online publication and is updated daily on week days.
Initial download of the metrics may take a while.