Fig. 5
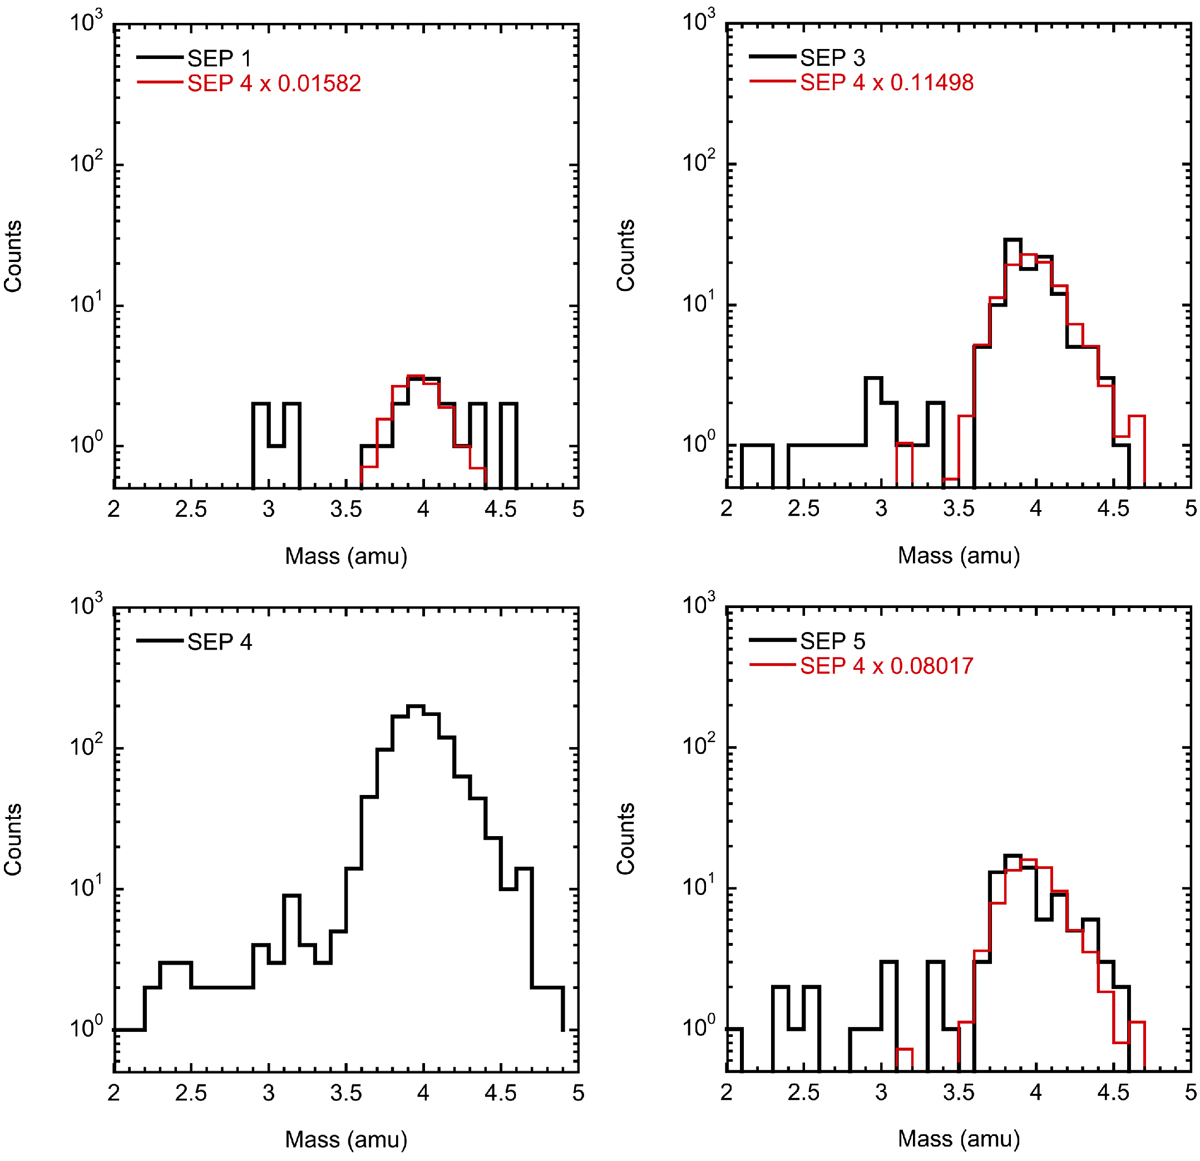
He mass histograms integrated over the time periods indicated in Table 1 for events 1, 3, 4, and 5. Also shown in red for events 1, 3, and 5 is the event 4 histogram scaled according to the values given in the legends. The distribution of counts in the mass region 2.5–3.5 in event 4 is consistent with spillover from the 4He peak evident in the mass region 3.5–4.5 and not indicative of the presence of 3He. In contrast, the other three events have an excess of counts corresponding to 3He (evident from the comparisons to the scaled event 4 histogram).
Current usage metrics show cumulative count of Article Views (full-text article views including HTML views, PDF and ePub downloads, according to the available data) and Abstracts Views on Vision4Press platform.
Data correspond to usage on the plateform after 2015. The current usage metrics is available 48-96 hours after online publication and is updated daily on week days.
Initial download of the metrics may take a while.