Fig. A.1
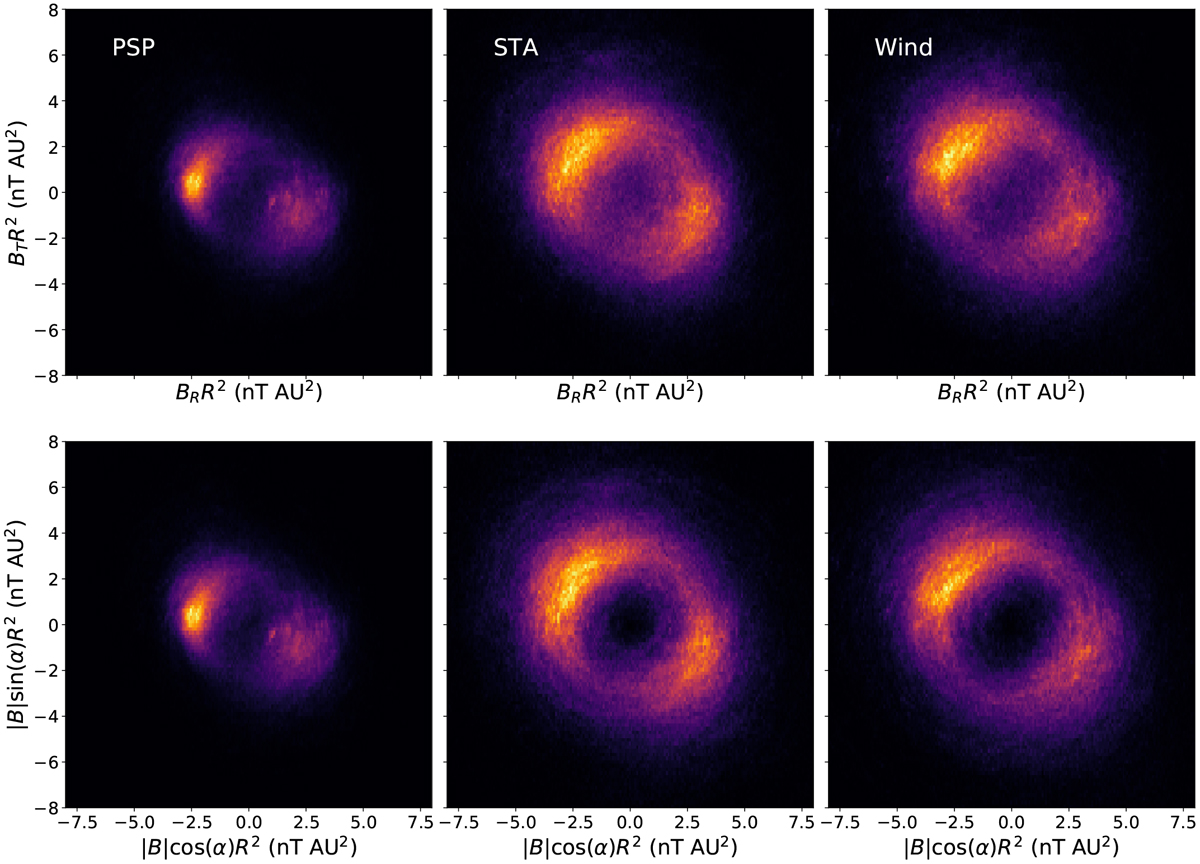
Justification of the treatment of the normal field component. Each panel shows a 2D distribution of field values across the full data set (see Fig. 1). Top row: distribution of 1 min average values of BT R2 versus BRR2. Bottom row:same axes and colour scale, the distribution formed by rotating the normal component into the R-T plane via the substitution BR = |B|cos(α), BT = |B|sin(α). The three columns show PSP, STA, and Wind data, respectively.
Current usage metrics show cumulative count of Article Views (full-text article views including HTML views, PDF and ePub downloads, according to the available data) and Abstracts Views on Vision4Press platform.
Data correspond to usage on the plateform after 2015. The current usage metrics is available 48-96 hours after online publication and is updated daily on week days.
Initial download of the metrics may take a while.