Fig. 12
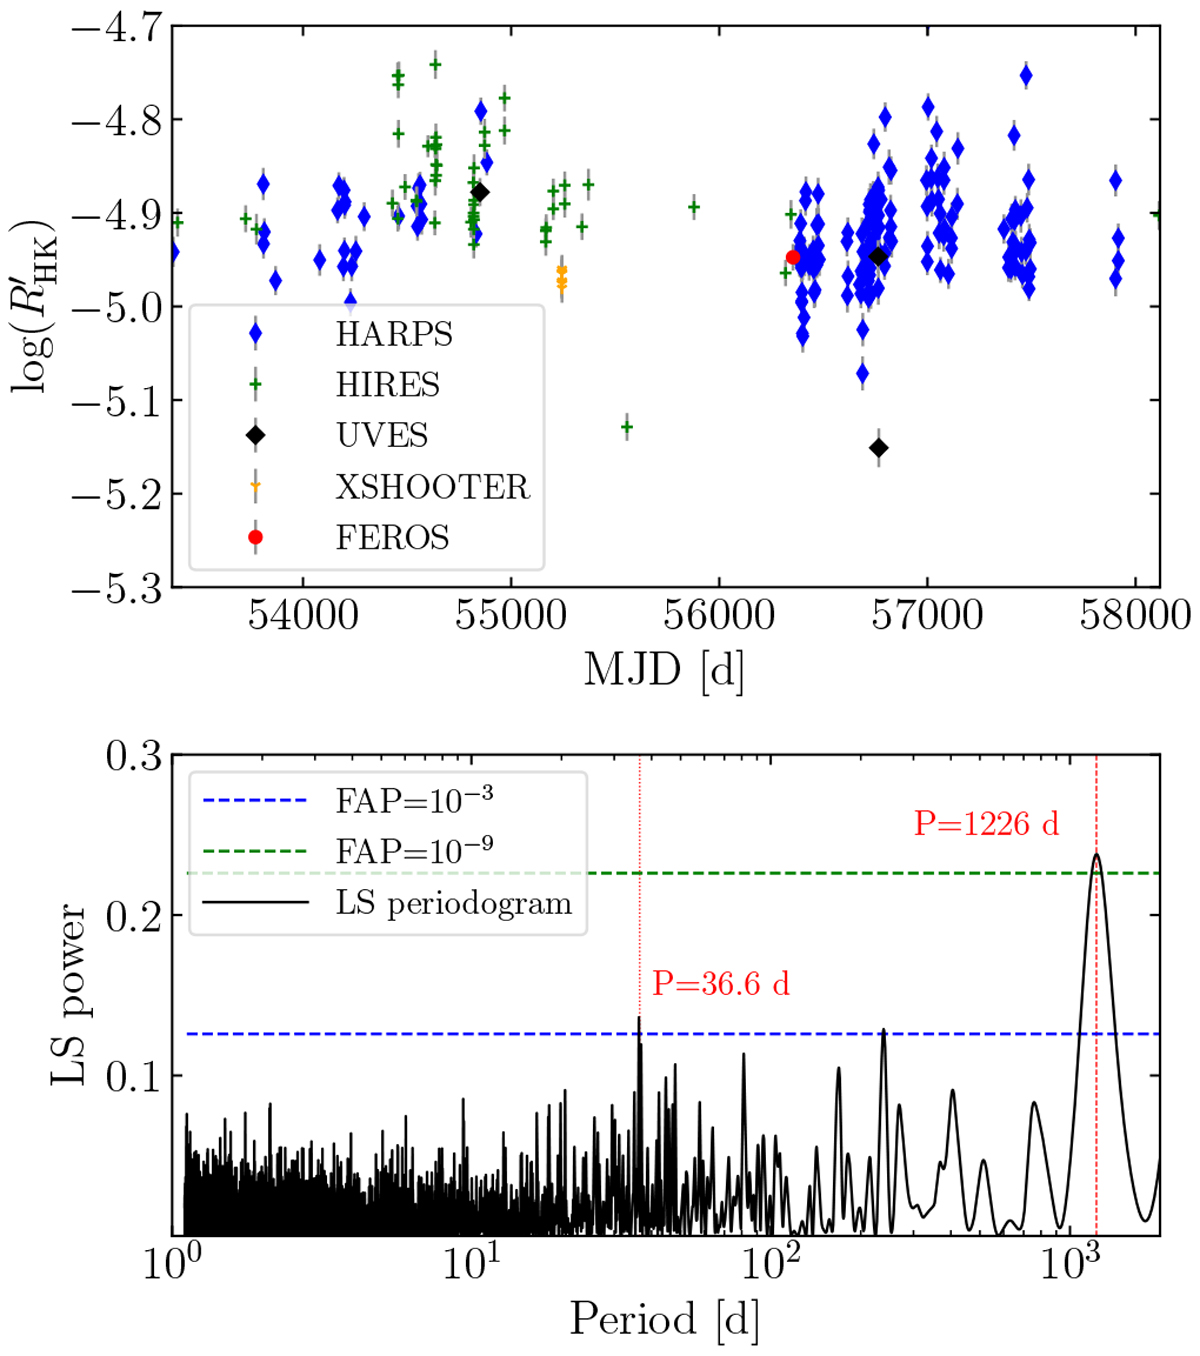
Top panel: ![]() time series of Gl 393. The source of the archival data is denoted by the colour coding. Bottom panel: generalised Lomb-Scargle periodogram of the
time series of Gl 393. The source of the archival data is denoted by the colour coding. Bottom panel: generalised Lomb-Scargle periodogram of the ![]() time series of Gl 393. The dashed vertical lines denote the periods of the activity cycle (P ≈ 1226 d) and stellar rotation (P ≈ 36.6 d) determined from the
time series of Gl 393. The dashed vertical lines denote the periods of the activity cycle (P ≈ 1226 d) and stellar rotation (P ≈ 36.6 d) determined from the ![]() time series. FAP levels of 10−3 and 10−9 are displayed as horizontal lines.
time series. FAP levels of 10−3 and 10−9 are displayed as horizontal lines.
Current usage metrics show cumulative count of Article Views (full-text article views including HTML views, PDF and ePub downloads, according to the available data) and Abstracts Views on Vision4Press platform.
Data correspond to usage on the plateform after 2015. The current usage metrics is available 48-96 hours after online publication and is updated daily on week days.
Initial download of the metrics may take a while.