Press Release
Free Access
Fig. 14
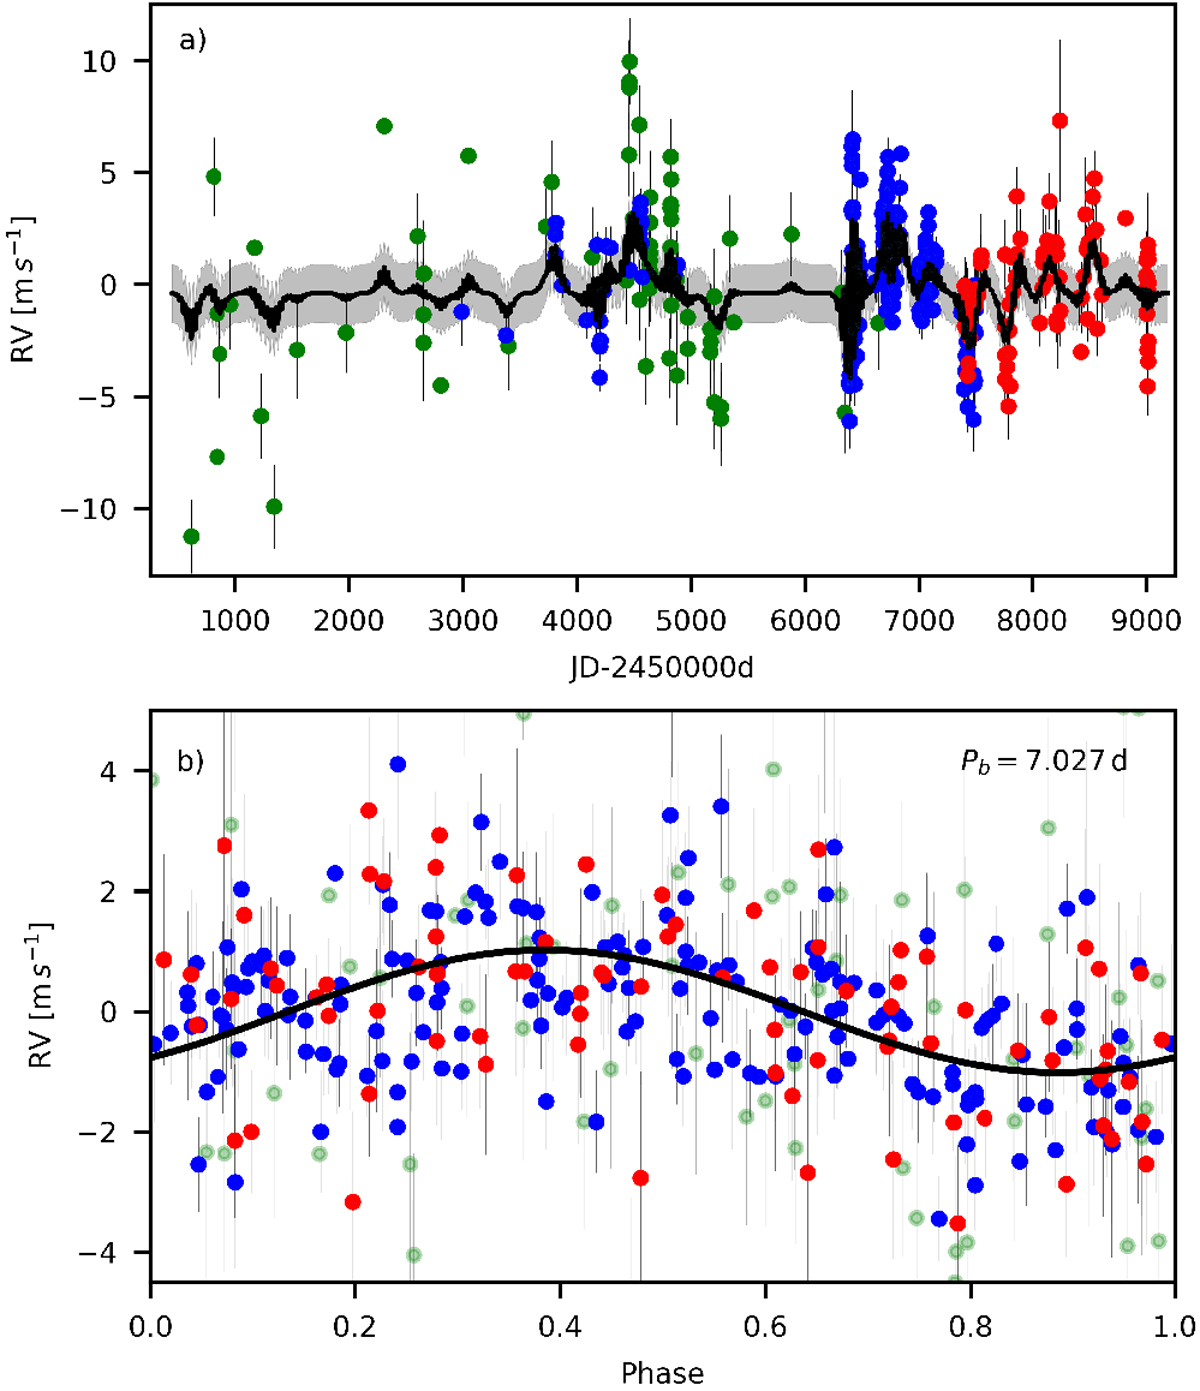
Gl 393. Panel a: GP fit (black solid line) and 1-sigma uncertainties (grey area) to theRV data of HIRES (green points), HARPS (blue points) and CARMENES VIS channel (red squares). Panel b: activity subtracted RVs, phase-folded to the 7.03 d period. The Keplerian model (black solid line) is overplotted.
Current usage metrics show cumulative count of Article Views (full-text article views including HTML views, PDF and ePub downloads, according to the available data) and Abstracts Views on Vision4Press platform.
Data correspond to usage on the plateform after 2015. The current usage metrics is available 48-96 hours after online publication and is updated daily on week days.
Initial download of the metrics may take a while.