Fig. 16
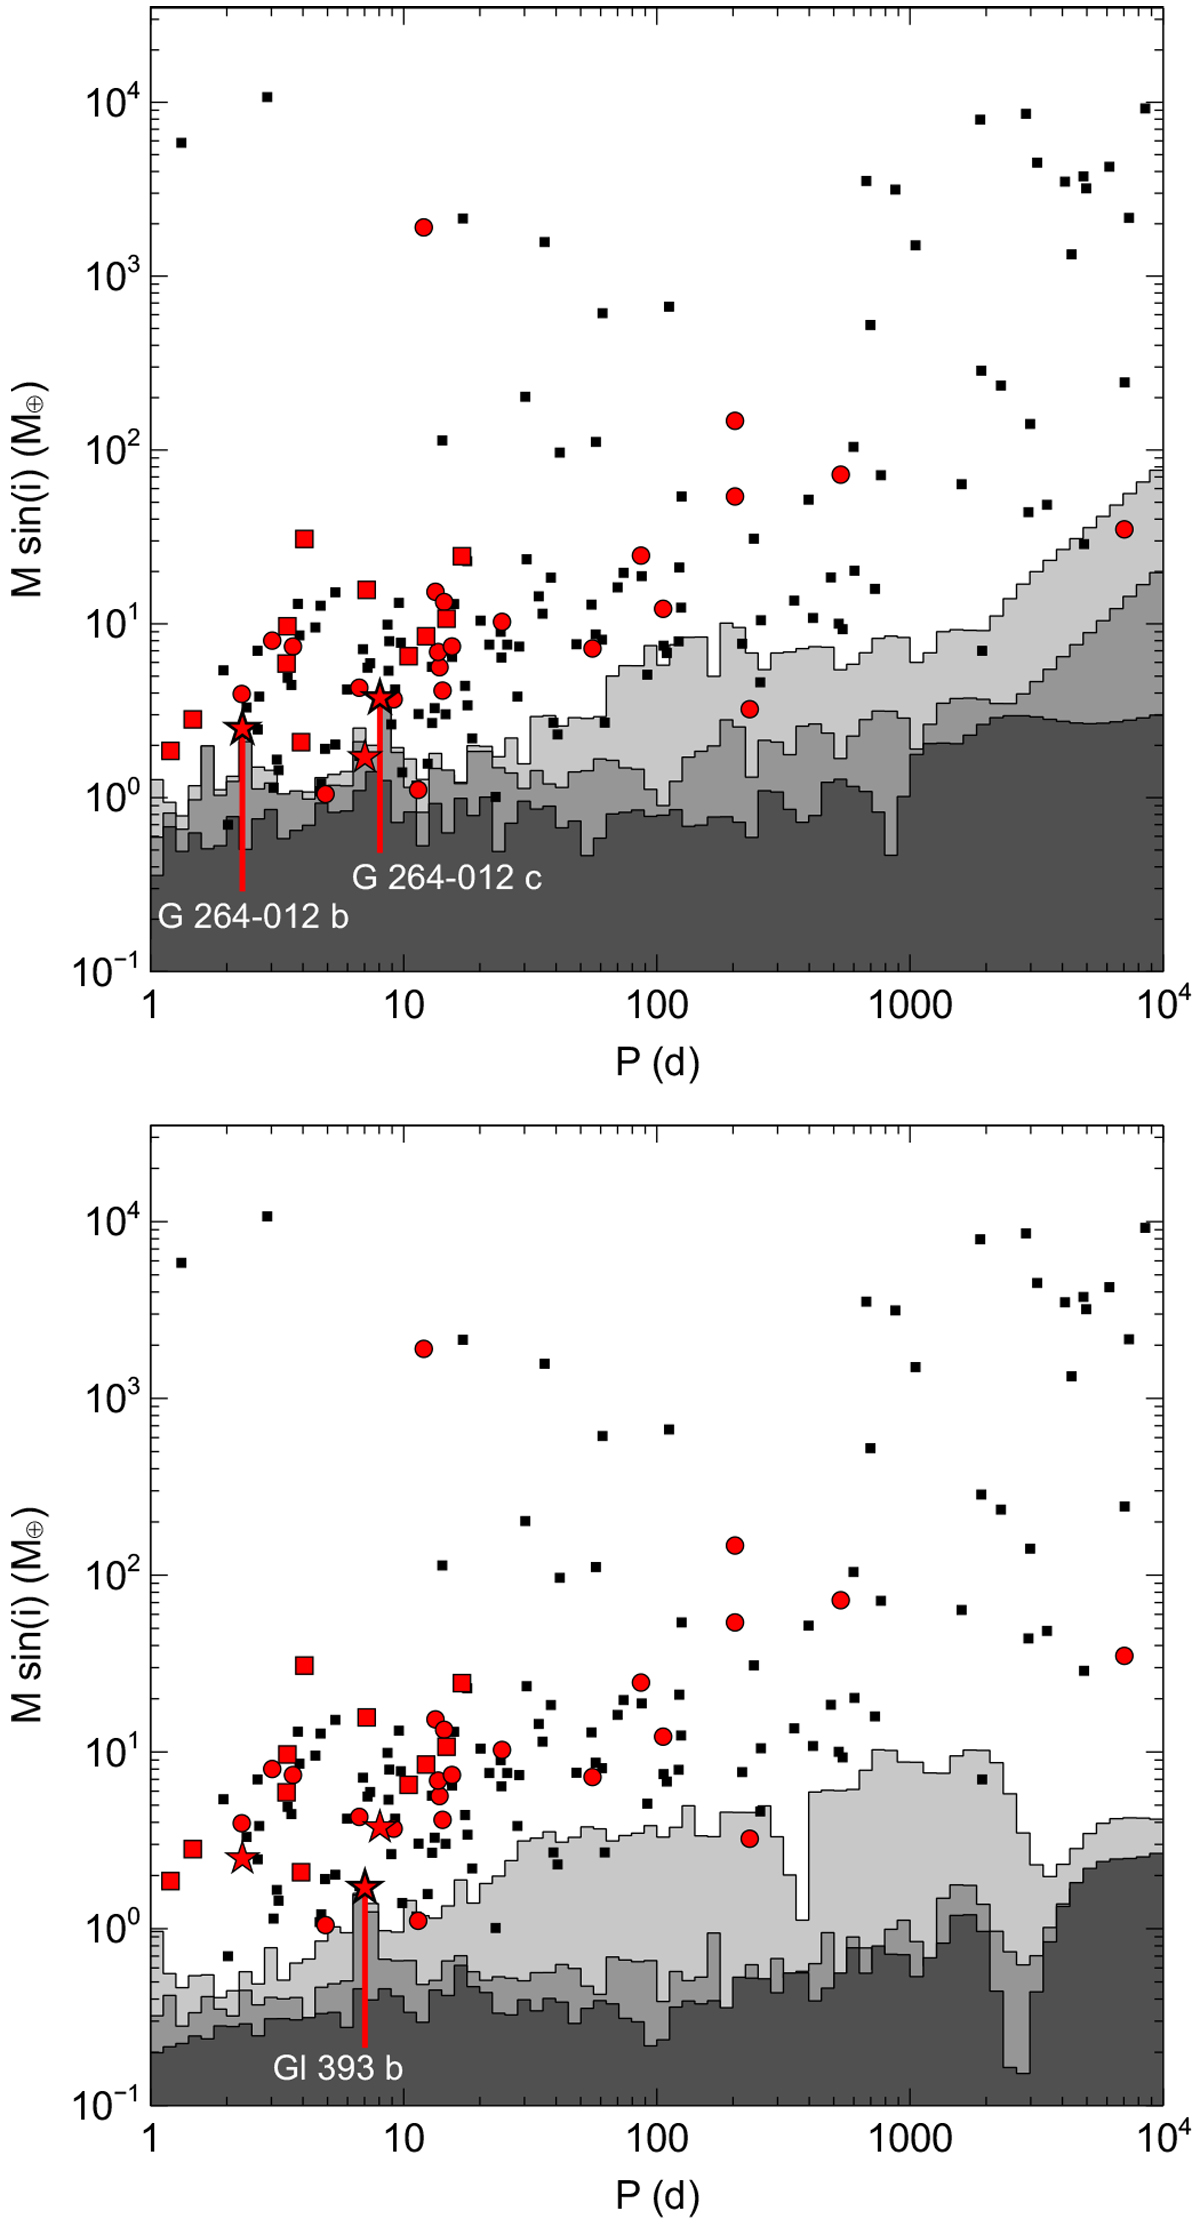
Maximum Msini value compatible with the RV measurements as a function of prospective orbital period. Upper panel: for G 264–012 RV curve. Lower panel: Gl 393 RV curve. From light to darker grey, detectability from original RV data (no modelling of planets or activity), data corrected for activity with GP, and data corrected from both, activity and planet signals. Symbols arethe same as in Fig. 15 with the planets in each of the two systems labelled only with b, c for G 264–012 and b for Gl 393.
Current usage metrics show cumulative count of Article Views (full-text article views including HTML views, PDF and ePub downloads, according to the available data) and Abstracts Views on Vision4Press platform.
Data correspond to usage on the plateform after 2015. The current usage metrics is available 48-96 hours after online publication and is updated daily on week days.
Initial download of the metrics may take a while.