Fig. 4
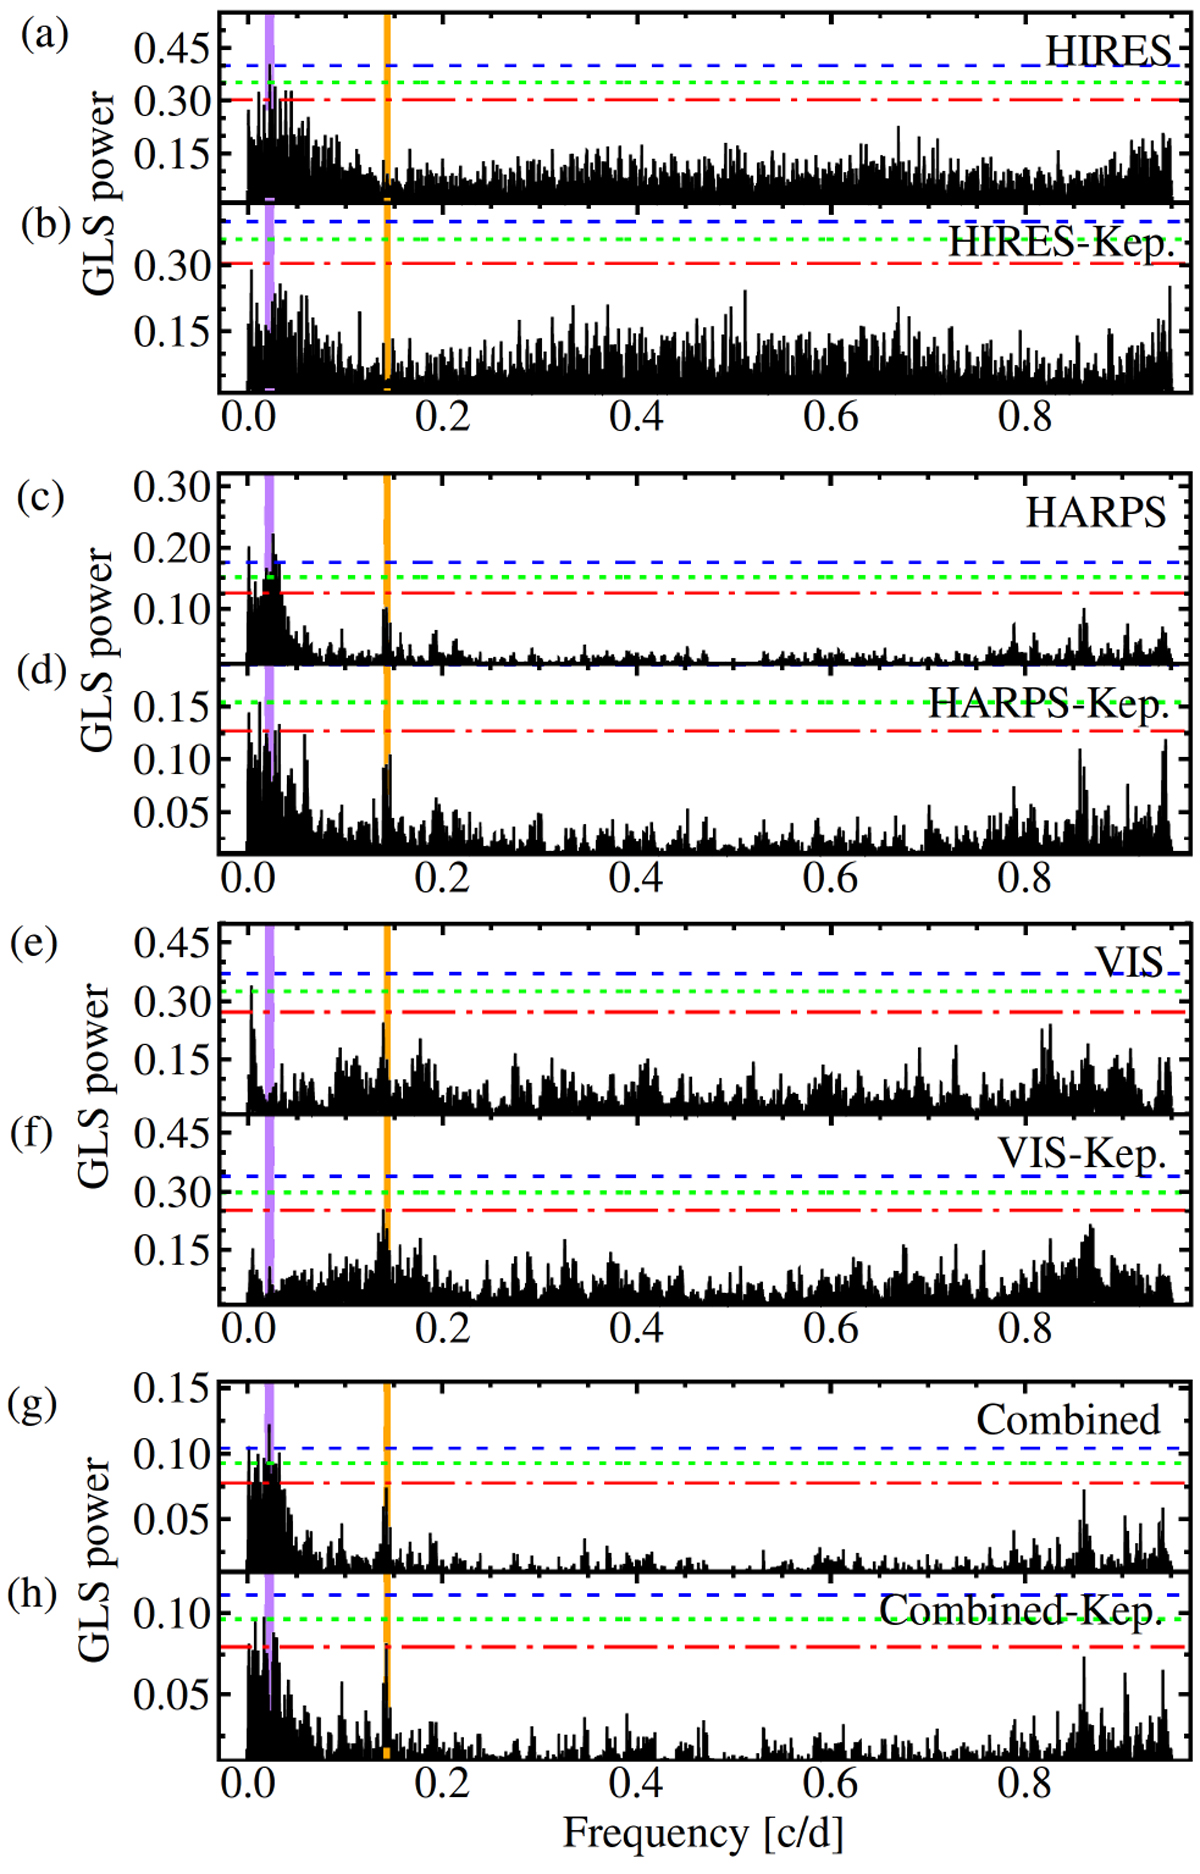
GLS periodograms for Gl 393. Panel a: HIRES data, and Panel b: HIRES data residuals after pre-whitening the highest peak with a Keplerian fit. Panels c and d: HARPS data (panel descriptions as in those for HIRES). Panels e and f: CARMENES VIS channel data. Panels g and h: combined data set. FAPs as in Fig. 3. Vertical dashed linesmark the highest peak found in the combined data (purple) and the highest peak after pre-whitening the GP (orange).
Current usage metrics show cumulative count of Article Views (full-text article views including HTML views, PDF and ePub downloads, according to the available data) and Abstracts Views on Vision4Press platform.
Data correspond to usage on the plateform after 2015. The current usage metrics is available 48-96 hours after online publication and is updated daily on week days.
Initial download of the metrics may take a while.