Fig. 5
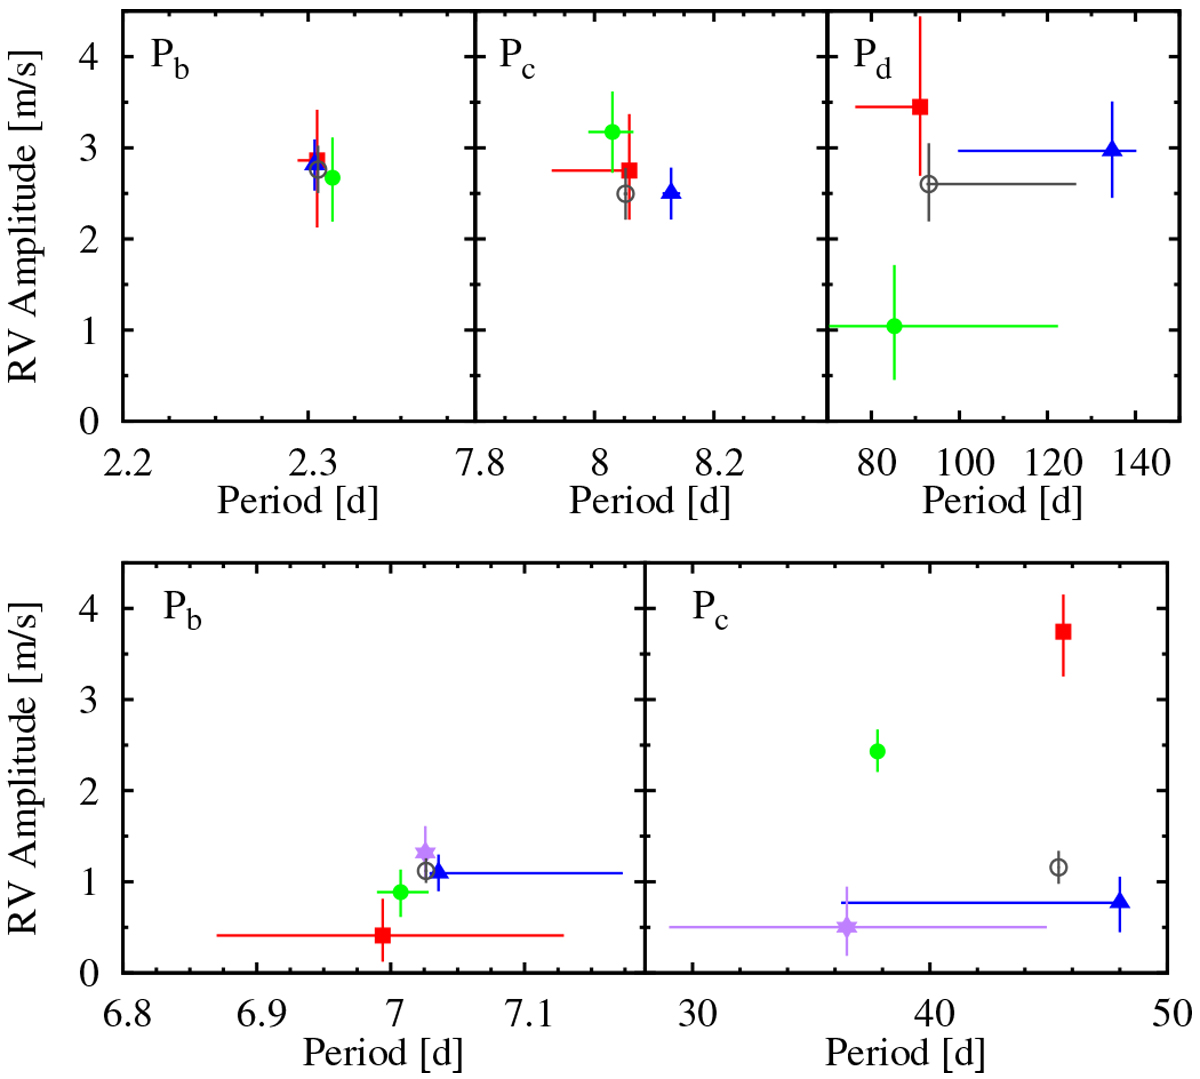
Top panels: period-amplitude diagrams of the Keplerian fits for the three signals in the G 264–012 RV data set split into seasons: 2016–17 (red squares), 2018 (green points), 2019 (blue triangles), and all data (grey circle). Bottom panels: same as the top panels but for the Gl 393 RV data split into subsets: HIRES (2008–2013; red squares), HARPS subset 1 (2003–2014; green points), HARPS subset 2 (2014–2017; blue triangles), CARMENES VIS (2016–2019; purple star), all data (grey circle).
Current usage metrics show cumulative count of Article Views (full-text article views including HTML views, PDF and ePub downloads, according to the available data) and Abstracts Views on Vision4Press platform.
Data correspond to usage on the plateform after 2015. The current usage metrics is available 48-96 hours after online publication and is updated daily on week days.
Initial download of the metrics may take a while.