Fig. 9
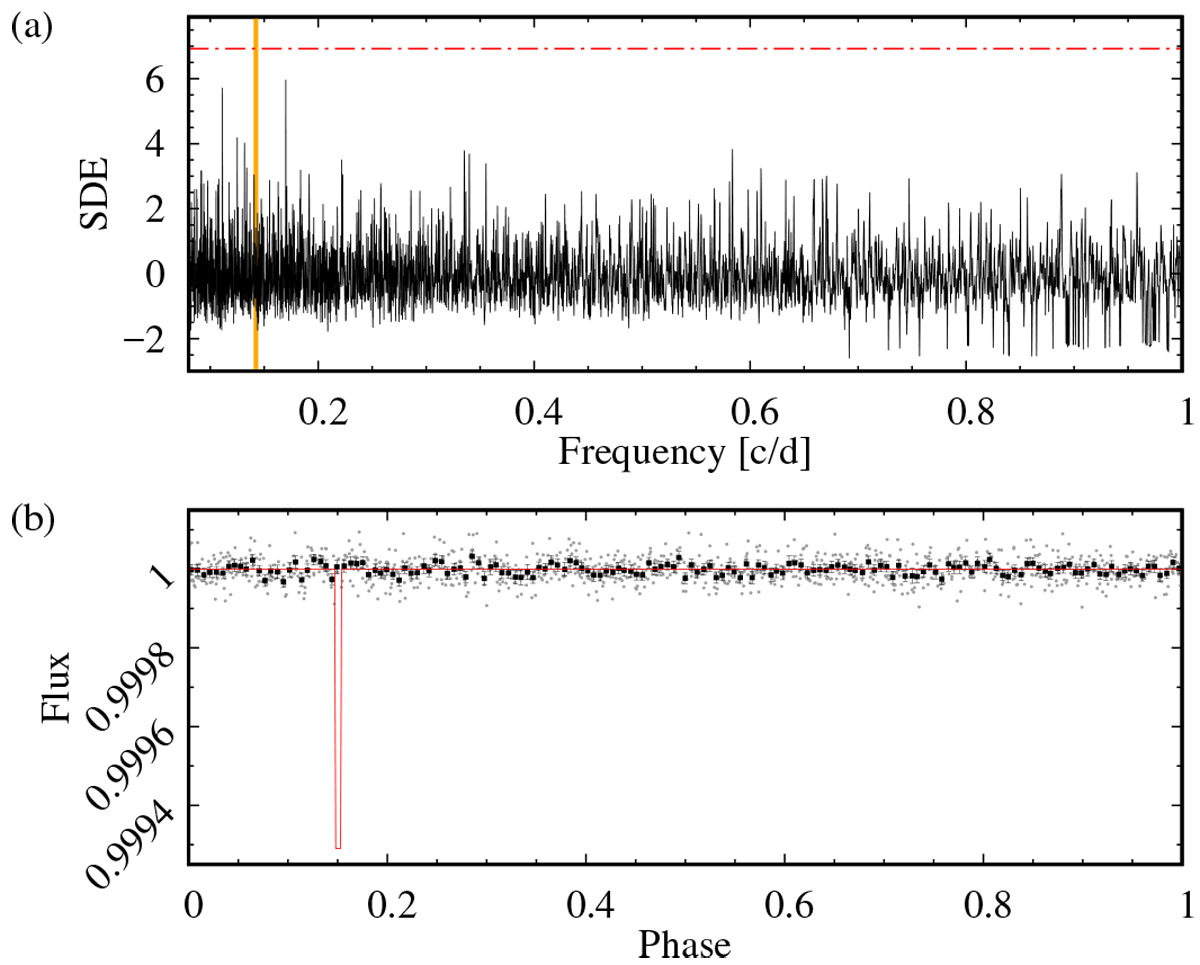
Gl 393. Panel a: transit search signal detection efficiency (SDE) as a function of frequency for K2 data. The horizontal dashed-dotted line marks the 10% FAP, while the vertical yellow dashed line marks the 7.0 d signal found in the RVs. Panel b: K2 data (grey) folded to the 7.0 d signal. Black dots are the binned K2 data, while the red line shows the simulated transit.
Current usage metrics show cumulative count of Article Views (full-text article views including HTML views, PDF and ePub downloads, according to the available data) and Abstracts Views on Vision4Press platform.
Data correspond to usage on the plateform after 2015. The current usage metrics is available 48-96 hours after online publication and is updated daily on week days.
Initial download of the metrics may take a while.