Fig. 10.
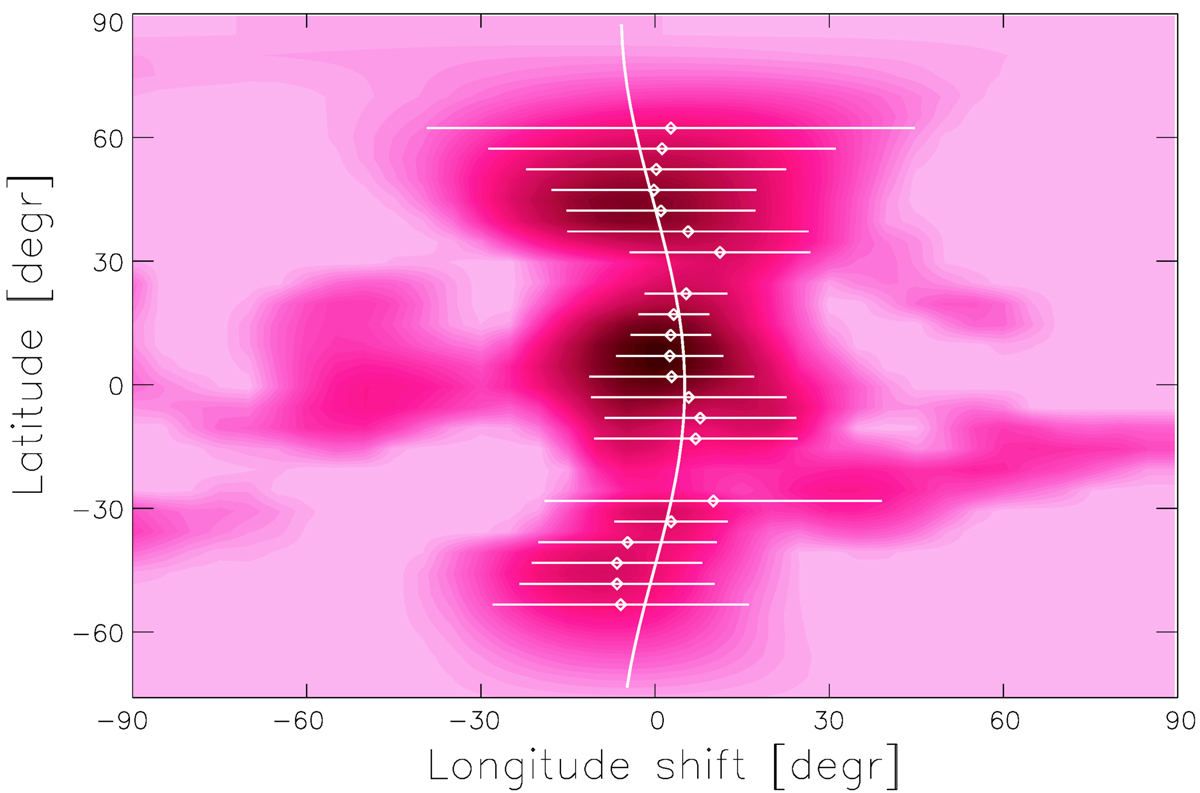
Average cross-correlation function map derived from the subsequent Doppler images plotted in Figs. 6 and 8. Black represents strong correlation, while light pink indicates no correlation. The quadratic sine fit (solid line) applied to the ridge of the correlation pattern (dots with error bars) suggests a solar-type rotational law with a very weak shear of αDR = 0.0026 ± 0.0006. See Sect. 5.3 for details.
Current usage metrics show cumulative count of Article Views (full-text article views including HTML views, PDF and ePub downloads, according to the available data) and Abstracts Views on Vision4Press platform.
Data correspond to usage on the plateform after 2015. The current usage metrics is available 48-96 hours after online publication and is updated daily on week days.
Initial download of the metrics may take a while.