Fig. 3.
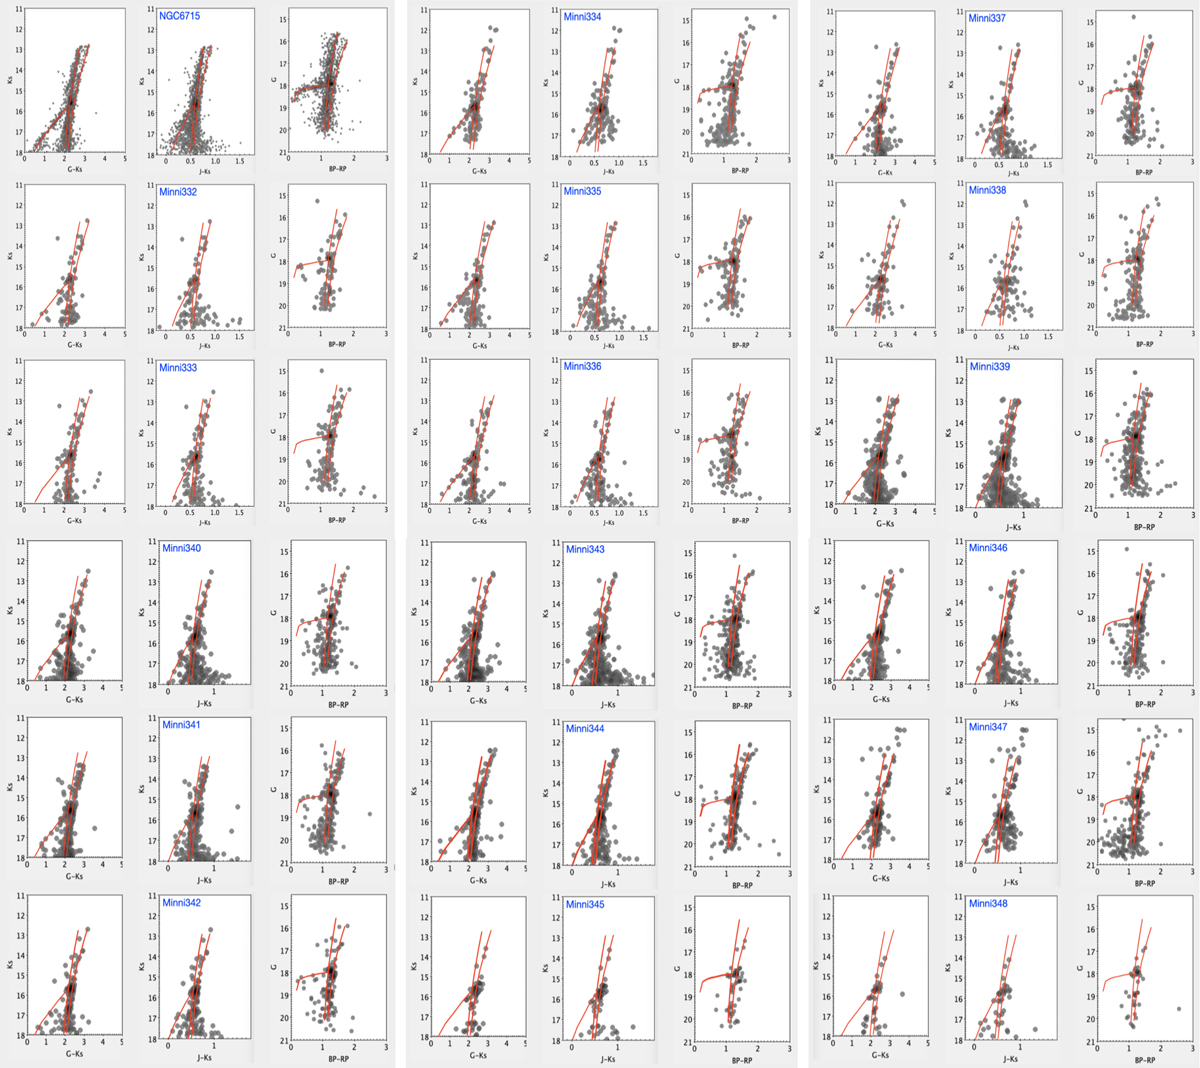
Observed optical and near-infrared color-magnitude diagrams for the PM selected cluster members within 3 arcmin centered on the new candidate GCs. The mean RGB and horizontal branch (HB) ridge lines of the metal-poor GC NGC 6715 and the metal-rich Sgr field population are shown for comparison (left and right red solid lines, respectively).
Current usage metrics show cumulative count of Article Views (full-text article views including HTML views, PDF and ePub downloads, according to the available data) and Abstracts Views on Vision4Press platform.
Data correspond to usage on the plateform after 2015. The current usage metrics is available 48-96 hours after online publication and is updated daily on week days.
Initial download of the metrics may take a while.