Fig. 3
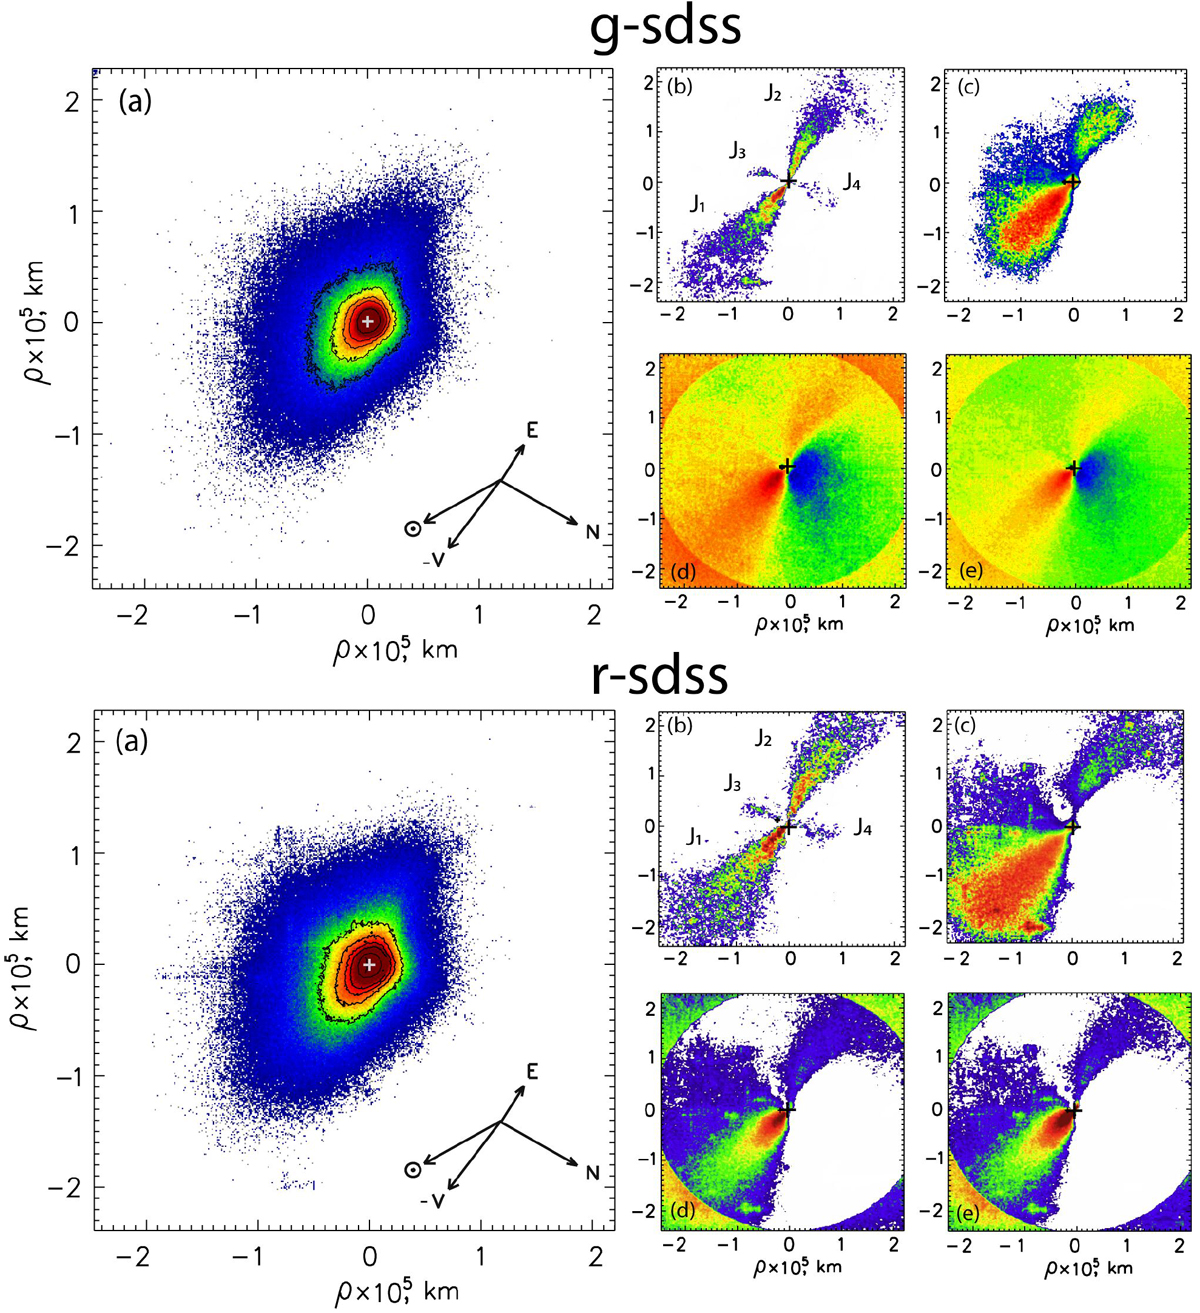
Intensity maps of comet C/2011 KP36 (Spacewatch) in the g-sdss and r-sdss filters. (a) Direct images of the comet with the isophots differing by a factor ![]() ; (b) image processed by a rotational gradient method (Larson & Sekanina 1984); (c), (d), and (e) images to which a division by 1/ρ profile, azimuthal average, and renormalization methods were applied, respectively (Samarasinha & Larson 2014). The color scale does not reflect the absolute brightness of the comet; it is only used to distinguish the areas of intensities that differ by
; (b) image processed by a rotational gradient method (Larson & Sekanina 1984); (c), (d), and (e) images to which a division by 1/ρ profile, azimuthal average, and renormalization methods were applied, respectively (Samarasinha & Larson 2014). The color scale does not reflect the absolute brightness of the comet; it is only used to distinguish the areas of intensities that differ by ![]() . Jet-like structures in the coma are indicated by J1, J2, J3, and J4. The arrows point in the directions to the Sun (⊙), north (N), east (E), and the negative velocity vector of the comet as seen in the observer’s plane of sky (V). Negative distance is in the solar direction, and positive distance is in the antisolar direction.
. Jet-like structures in the coma are indicated by J1, J2, J3, and J4. The arrows point in the directions to the Sun (⊙), north (N), east (E), and the negative velocity vector of the comet as seen in the observer’s plane of sky (V). Negative distance is in the solar direction, and positive distance is in the antisolar direction.
Current usage metrics show cumulative count of Article Views (full-text article views including HTML views, PDF and ePub downloads, according to the available data) and Abstracts Views on Vision4Press platform.
Data correspond to usage on the plateform after 2015. The current usage metrics is available 48-96 hours after online publication and is updated daily on week days.
Initial download of the metrics may take a while.