Fig. 10
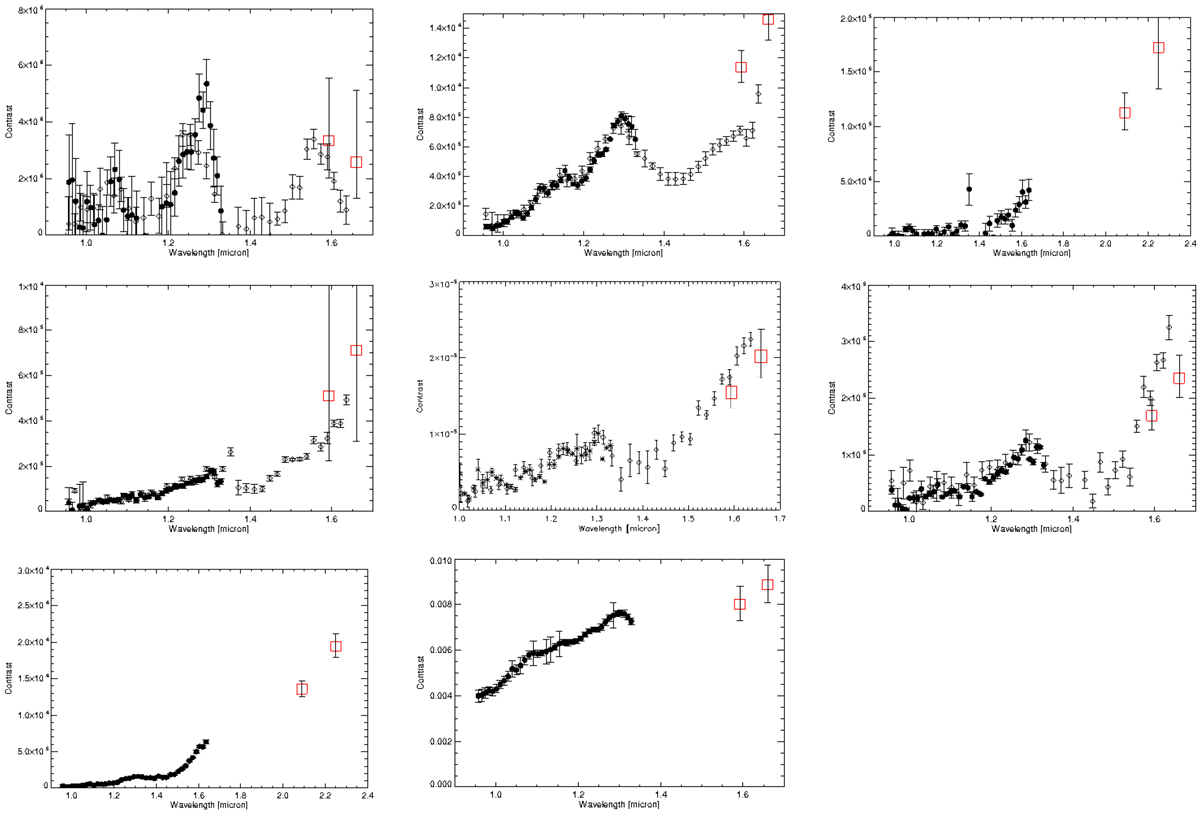
SPHERE contrast spectra of substellar companions detected within the sample of stars considered in this paper, shown as black symbols. Upper row: left: 51 Eri b; center: β Pic b; right: HD 95086 b. Middle row: left: HIP 65426 b; center: HR 8799 d; right: HR 8799 e. Lower row: left: HIP 107412 B; center: PZ Tel B. Results shown are obtained by making a median of results at different epochs with good quality results. Spectra obtained with the YJand YH mode were kept separate. The error bar is either the result of thescatter of results at different epochs, or if only one was available in that epoch, the error bar obtained by considering other positions at the same separation from the star. The spectra shown were obtained using ASDI PCA and corrected for the attenuation factor using fake planets at similar separation. This method is reasonable when the contrast is very large, so that the planet cannot be seen well at individual wavelengths. Red symbols are the contrast values obtained from IRDIS data. We note that there is some offset between IFS and IRDIS contrasts. This is at least in part due to the non-optimal extraction of IFS spectra shown in this figure. More accurate spectral extractions may be found in papers discussing the individual targets.
Current usage metrics show cumulative count of Article Views (full-text article views including HTML views, PDF and ePub downloads, according to the available data) and Abstracts Views on Vision4Press platform.
Data correspond to usage on the plateform after 2015. The current usage metrics is available 48-96 hours after online publication and is updated daily on week days.
Initial download of the metrics may take a while.