Fig. B.3
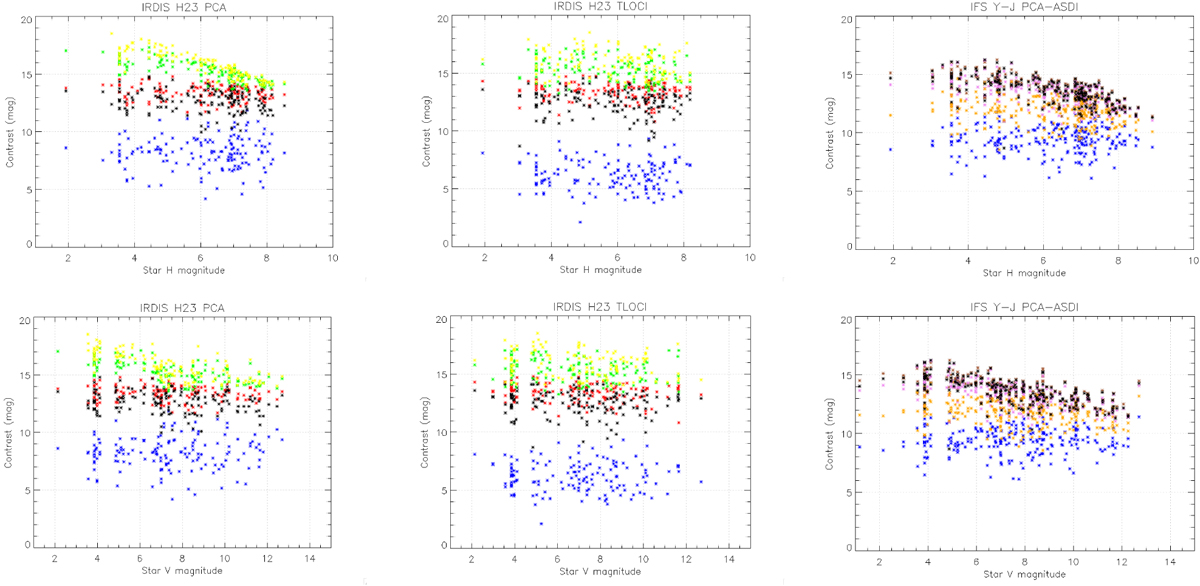
IRDIFS contrasts estimated at various separations as function of the sample stars V and H magnitude. Both IRDIS and IFS contrasts are shown separately. IRDIS contrasts using PCA reduction and TLOCI are shown in the left and middle figures. The color code for IRDIS is as follows: blue is for 100 mas separation, black for 500 mas separation, red for 1000 mas separation, green for 2000 mas separation, and yellow for 4000 mas separations. IFS contrasts using PCA-ASDI reduction are shown on the right side figure. The color code for IFS is as follow. Blue is for 100 mas separation, orange is for 200 mas separation, pink is for 400 mas separation, black for 500 mas separation, brown is for 700 mas separations.
Current usage metrics show cumulative count of Article Views (full-text article views including HTML views, PDF and ePub downloads, according to the available data) and Abstracts Views on Vision4Press platform.
Data correspond to usage on the plateform after 2015. The current usage metrics is available 48-96 hours after online publication and is updated daily on week days.
Initial download of the metrics may take a while.