Fig. 4
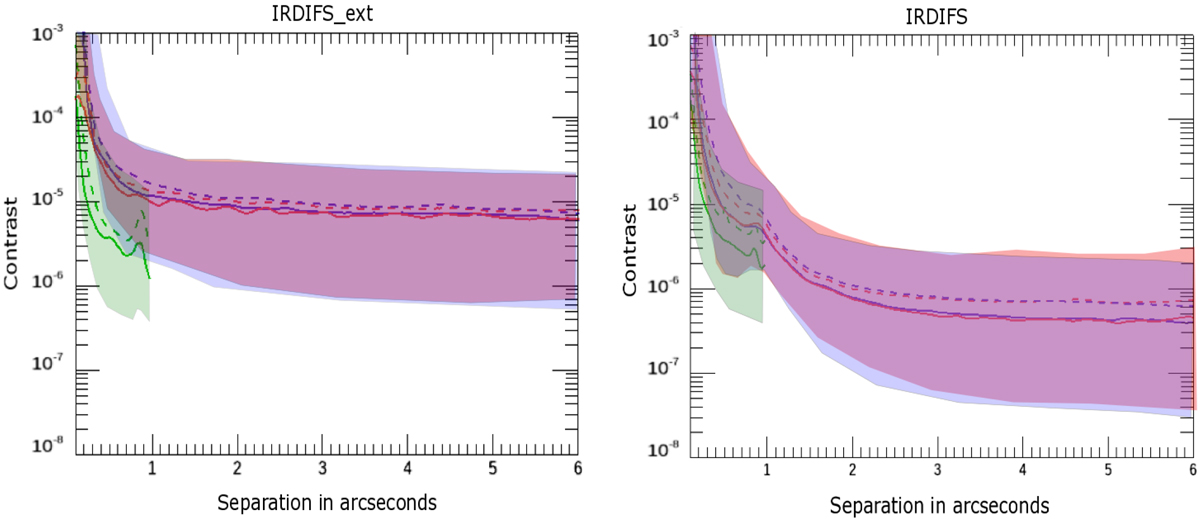
Contrast curves at 5σ obtained for the full sample for irdifs-ext (left) and irdifs (right) modes observations. The solid line gives the median value of the contrast. The dashed line gives the mean value of the contrast. Red indicates IRDIS data reduced in PCA ADI; blue indicates IRDIS data reduced in TLOCI ADI; and green indicates IFS with a PCA ASDI reduction.
Current usage metrics show cumulative count of Article Views (full-text article views including HTML views, PDF and ePub downloads, according to the available data) and Abstracts Views on Vision4Press platform.
Data correspond to usage on the plateform after 2015. The current usage metrics is available 48-96 hours after online publication and is updated daily on week days.
Initial download of the metrics may take a while.