Fig. 10
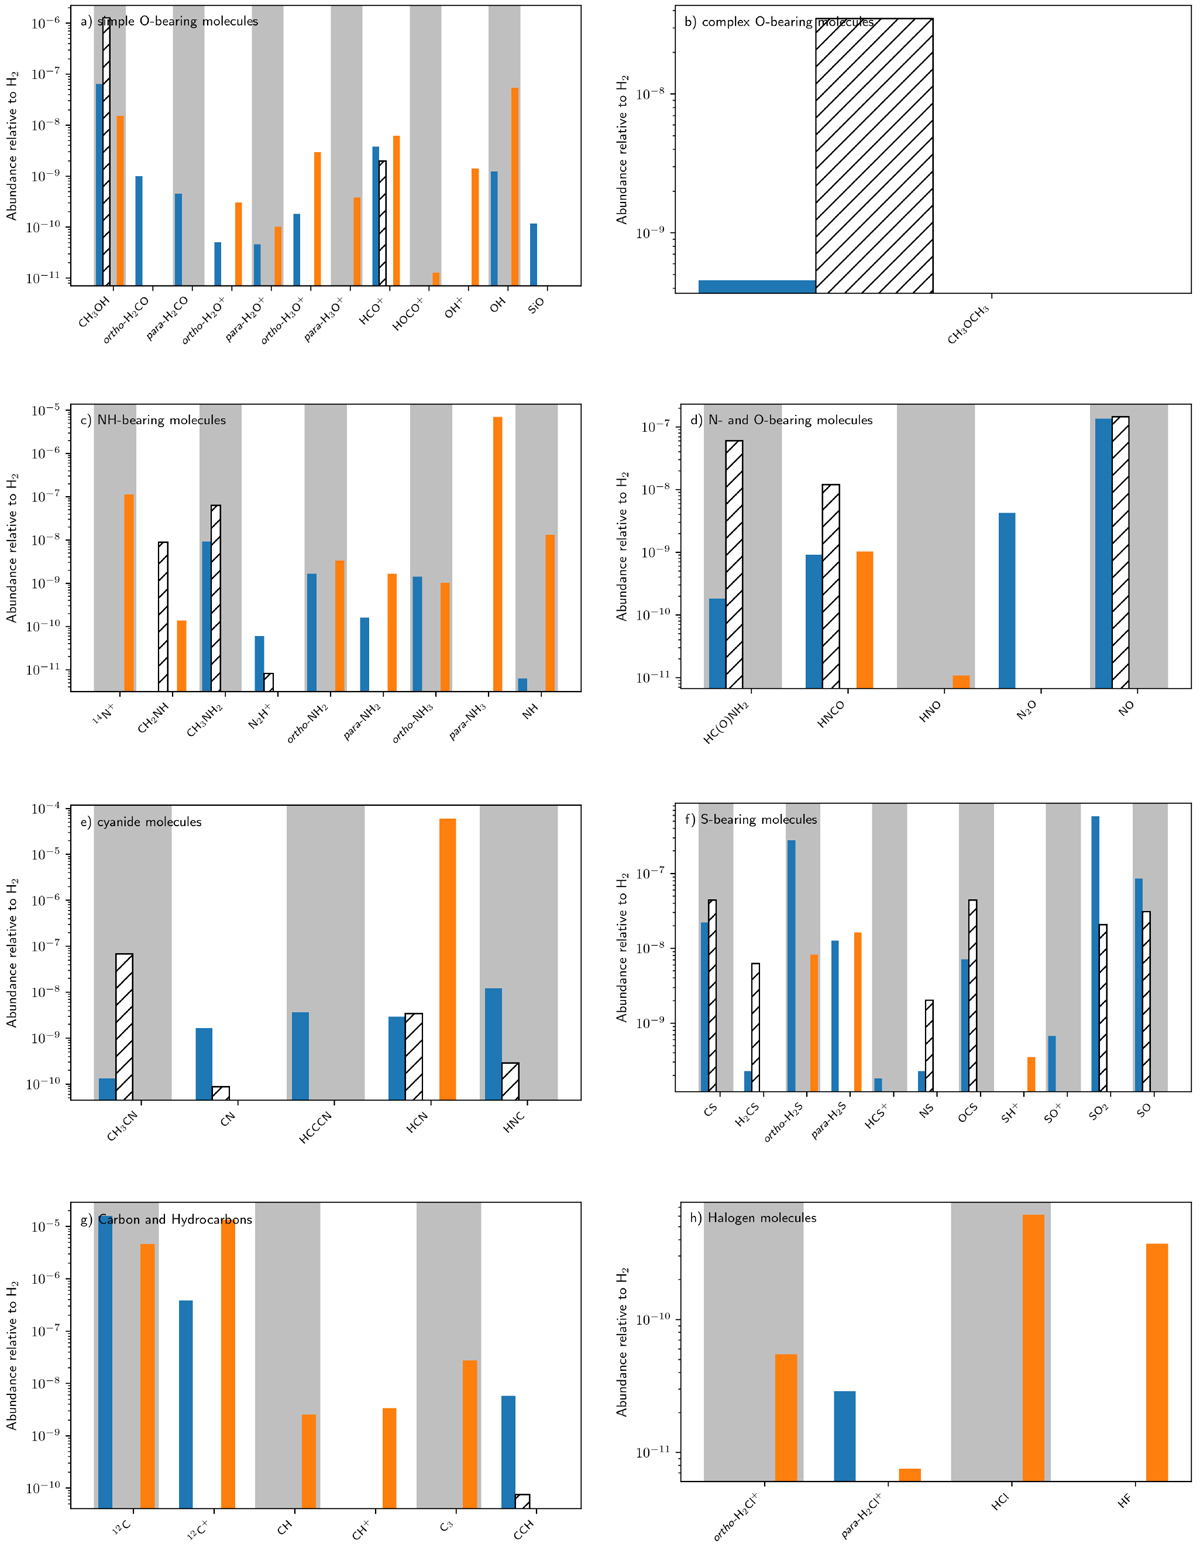
Abundances for different molecule families (a–g) as described in Sect. 4. The blue and orange bars indicate the abundances of core and envelope components, respectively. The hatched bars indicate abundances in the hot core of Sgr B2(N) with respect to H2, derived by Neill et al. (2014). Since the distinction between ortho and para was not done by Neill et al. (2014), we compare theabundances of the ortho and para molecules with the unresolved results of Sgr B2(N).
Current usage metrics show cumulative count of Article Views (full-text article views including HTML views, PDF and ePub downloads, according to the available data) and Abstracts Views on Vision4Press platform.
Data correspond to usage on the plateform after 2015. The current usage metrics is available 48-96 hours after online publication and is updated daily on week days.
Initial download of the metrics may take a while.