Fig. 3.
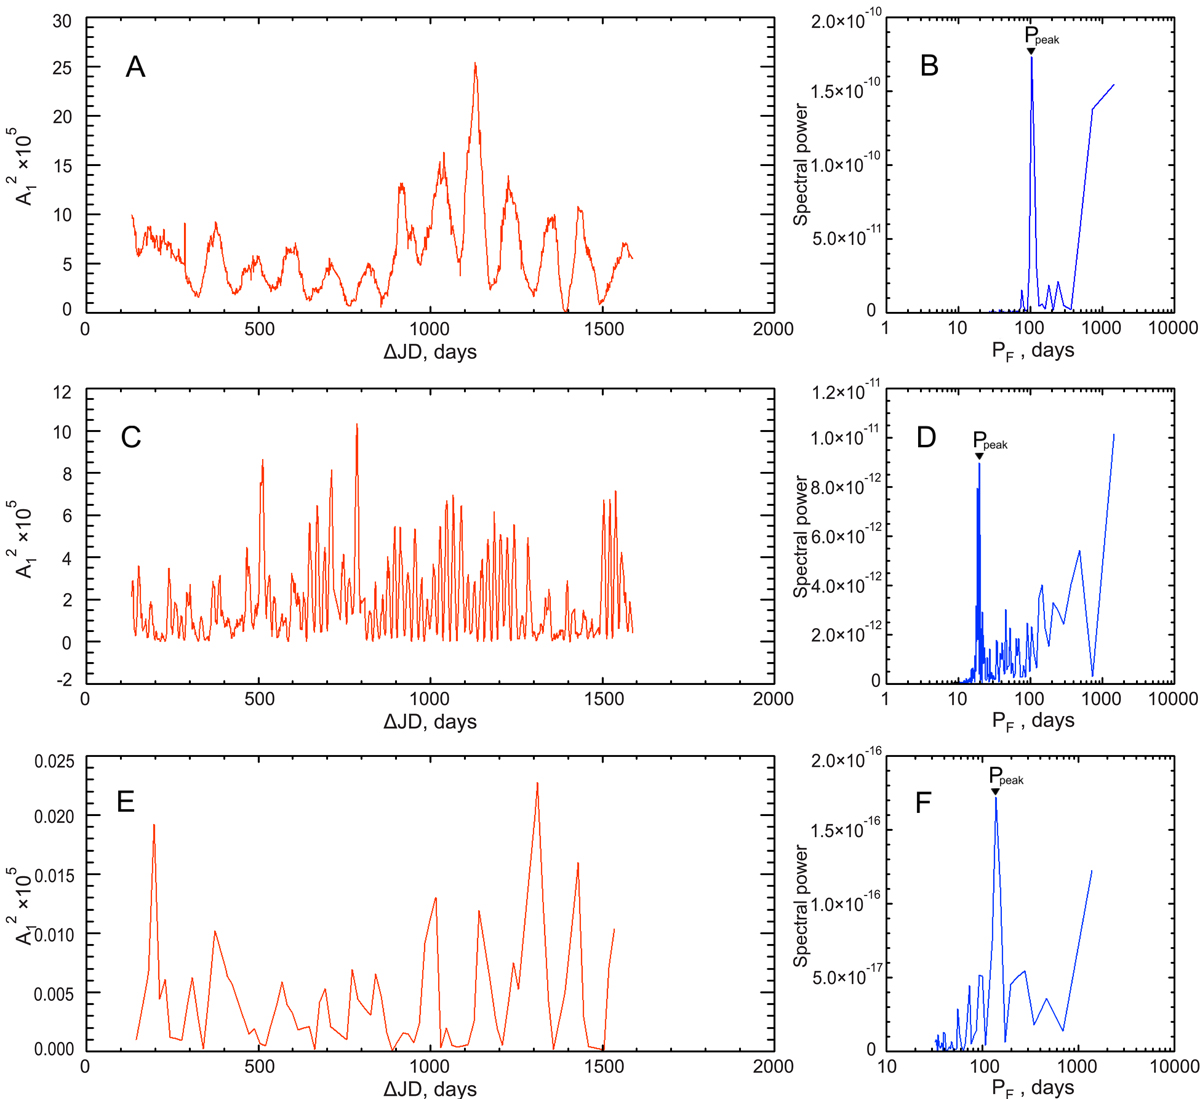
Oscillatory behavior of the activity index ![]() time series and their corresponding power spectra, obtained for KIC 12365719 with P = 0.854 days and Teff = 3556 K (panels A and B), for KIC 8144578 with P = 0.593 days and Teff = 6641 K (panels C and D), and for KIC 7671028 with P = 15.623 days and Teff = 6675 K (panels E and F). The abscissa units ΔJD in panels A, C, and E are the Julian days counted from JD 2454833. The peak of maximum amplitude is indicated by an arrow and labeled Ppeak.
time series and their corresponding power spectra, obtained for KIC 12365719 with P = 0.854 days and Teff = 3556 K (panels A and B), for KIC 8144578 with P = 0.593 days and Teff = 6641 K (panels C and D), and for KIC 7671028 with P = 15.623 days and Teff = 6675 K (panels E and F). The abscissa units ΔJD in panels A, C, and E are the Julian days counted from JD 2454833. The peak of maximum amplitude is indicated by an arrow and labeled Ppeak.
Current usage metrics show cumulative count of Article Views (full-text article views including HTML views, PDF and ePub downloads, according to the available data) and Abstracts Views on Vision4Press platform.
Data correspond to usage on the plateform after 2015. The current usage metrics is available 48-96 hours after online publication and is updated daily on week days.
Initial download of the metrics may take a while.