Free Access
Fig. 3.
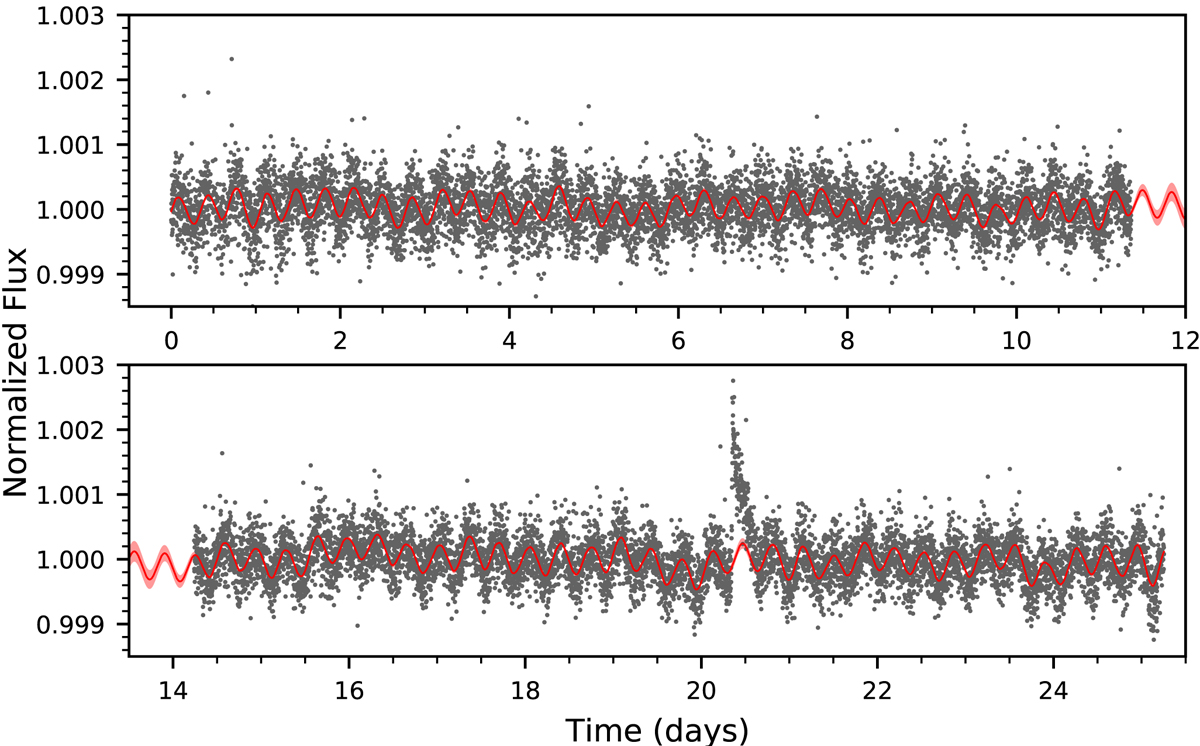
TESS broadband (600–1000 nm) normalised photometric time series of HD 152384 (black dots), covering the time period May 21, 2019, to June 18, 2019. In addition to the periodic variations on an 8.286 h timescale, a flare can be seen in the data around 20.5 days. The red line shows the GP fitted to the data.
Current usage metrics show cumulative count of Article Views (full-text article views including HTML views, PDF and ePub downloads, according to the available data) and Abstracts Views on Vision4Press platform.
Data correspond to usage on the plateform after 2015. The current usage metrics is available 48-96 hours after online publication and is updated daily on week days.
Initial download of the metrics may take a while.