Fig. 1.
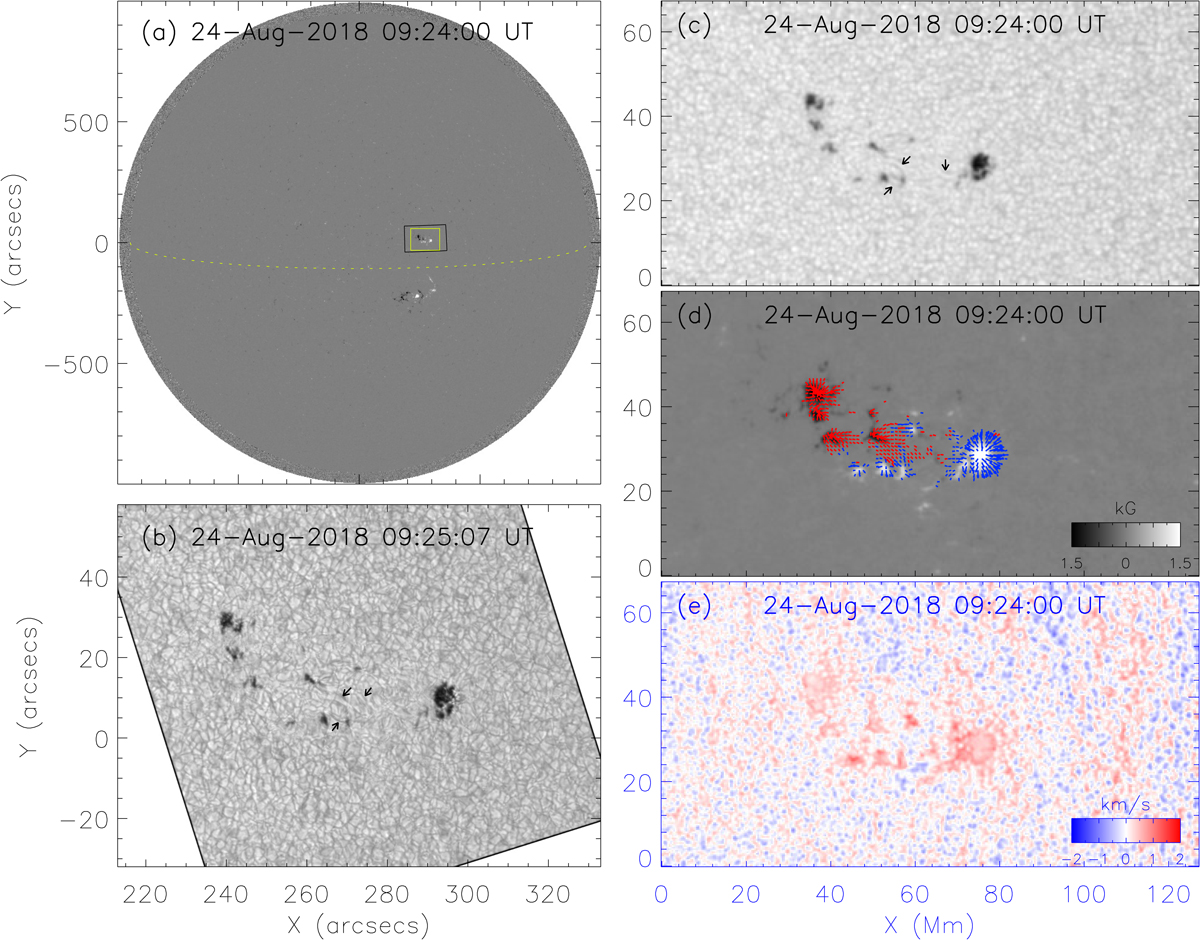
Overview of the emerging active region. Panel a: global line-of-sight magnetic field observed by SDO/HMI. The yellow dashed line marks the solar equator. The yellow and black boxes outline the fields of view of panel (b) and panels (c)–(e), respectively; panel b: TiO image observed by NVST; panel c: continuum intensity image from SHARP data; panel d: vector magnetograms from SHARP data; blue and red arrows indicate the transverse field with positive and negative flux, respectively; panel e: doppler velocity from SHARP data.
Current usage metrics show cumulative count of Article Views (full-text article views including HTML views, PDF and ePub downloads, according to the available data) and Abstracts Views on Vision4Press platform.
Data correspond to usage on the plateform after 2015. The current usage metrics is available 48-96 hours after online publication and is updated daily on week days.
Initial download of the metrics may take a while.