Free Access
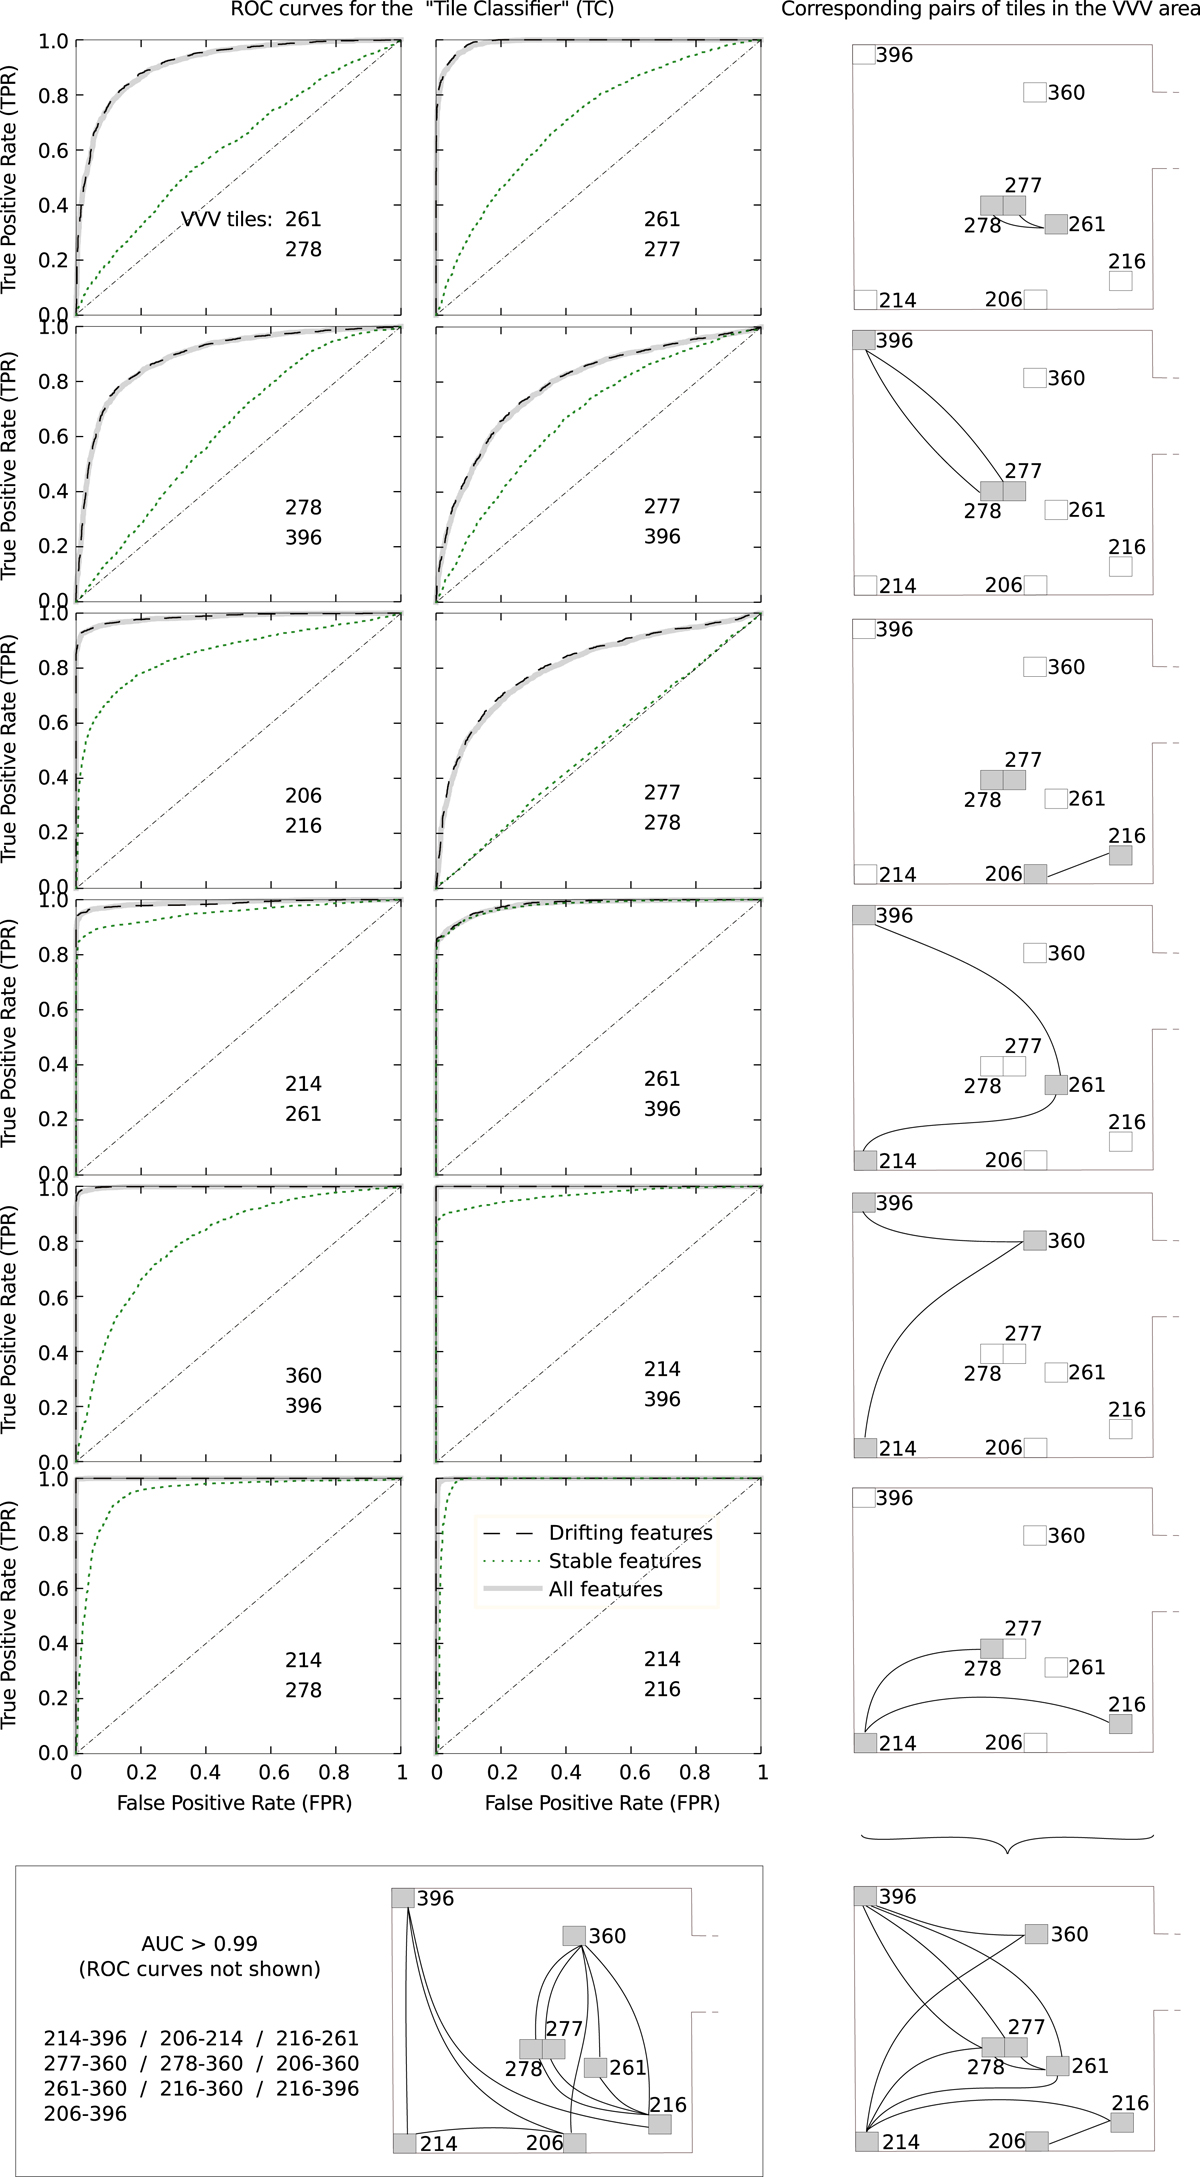
Fig. 4.
Download original image
ROC curves for the combinations of two tiles, selecting the more important features. Each panel has three curves: one using all the features (thick grey lines), the drifting features selected by RFE (dashed lines), and those considered stable and not selected by RFE (dotted lines).
Current usage metrics show cumulative count of Article Views (full-text article views including HTML views, PDF and ePub downloads, according to the available data) and Abstracts Views on Vision4Press platform.
Data correspond to usage on the plateform after 2015. The current usage metrics is available 48-96 hours after online publication and is updated daily on week days.
Initial download of the metrics may take a while.