Free Access
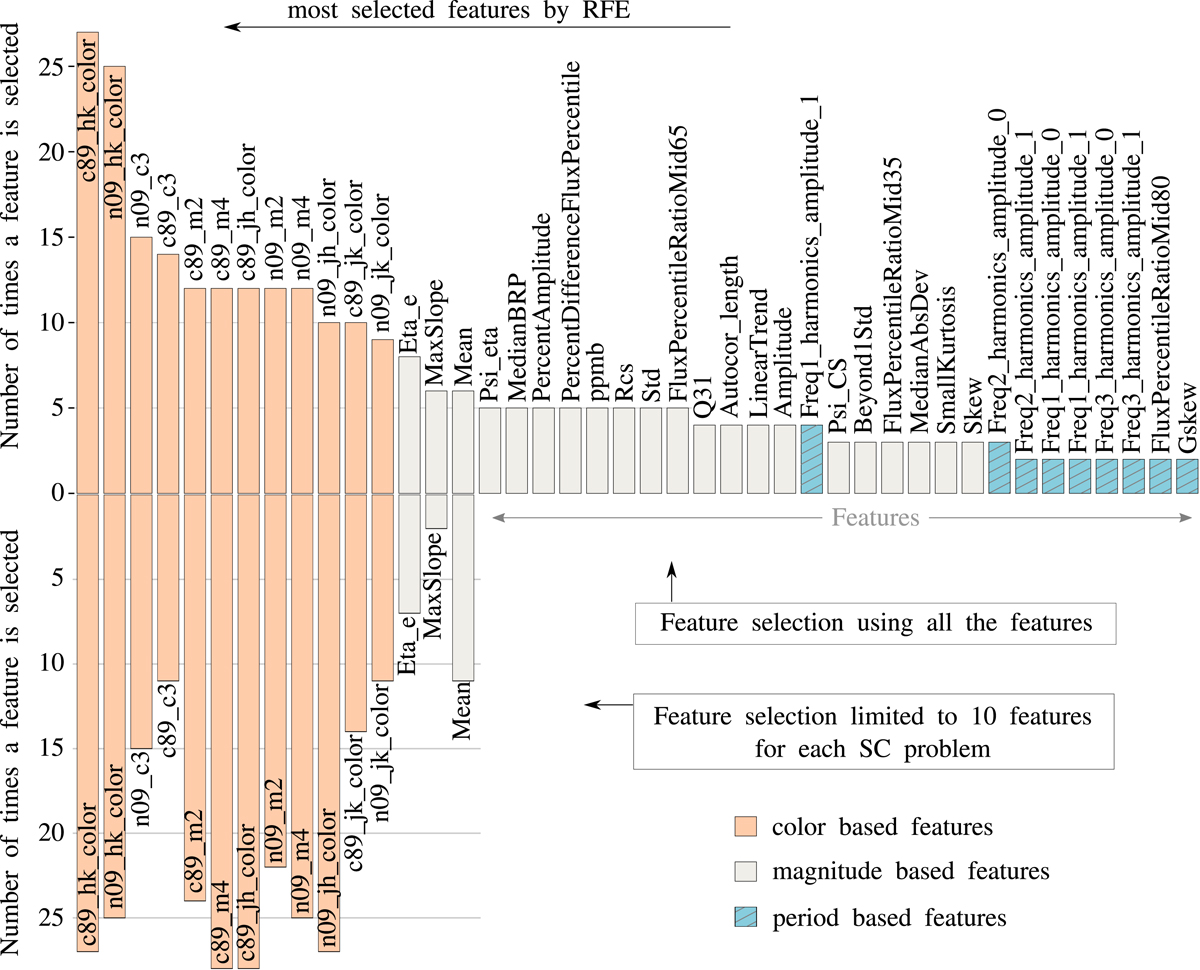
Fig. 5.
Download original image
Total times that each feature was selected by RFECV over the 28 SC problems considered in this work. The different colours identify which of the three groups each feature belongs to: orange for those based on colour, blue for those based on period, and white for those based only on magnitude.
Current usage metrics show cumulative count of Article Views (full-text article views including HTML views, PDF and ePub downloads, according to the available data) and Abstracts Views on Vision4Press platform.
Data correspond to usage on the plateform after 2015. The current usage metrics is available 48-96 hours after online publication and is updated daily on week days.
Initial download of the metrics may take a while.