Fig. 1.
Download original image
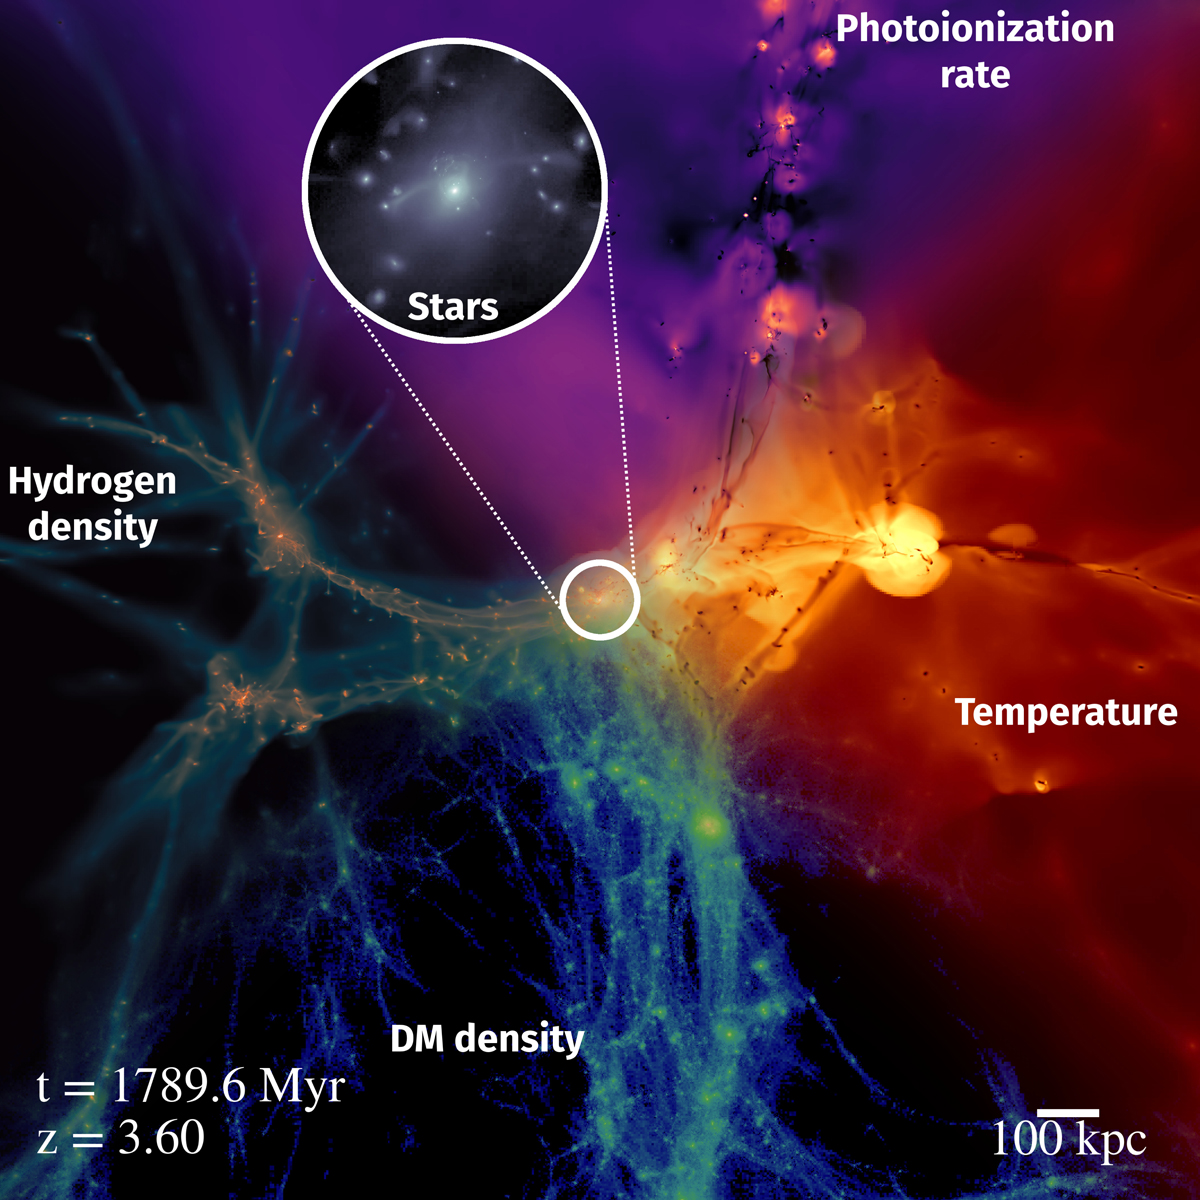
Snapshot of the central region of the OBELISK, illustrating the physics modelled in the simulation. The complex gas distribution is shown on the left, the corresponding DM skeleton on the bottom, the gas temperature on the right highlighting self-shielded filaments (dark brown) and hot feedback bubbles (in yellow), and the upper part shows the H I photoionization rate with the knots of the cosmic web lit up by bright sources. The inset zooms in on the stellar distribution around the central galaxy.
Current usage metrics show cumulative count of Article Views (full-text article views including HTML views, PDF and ePub downloads, according to the available data) and Abstracts Views on Vision4Press platform.
Data correspond to usage on the plateform after 2015. The current usage metrics is available 48-96 hours after online publication and is updated daily on week days.
Initial download of the metrics may take a while.