Fig. 11.
Download original image
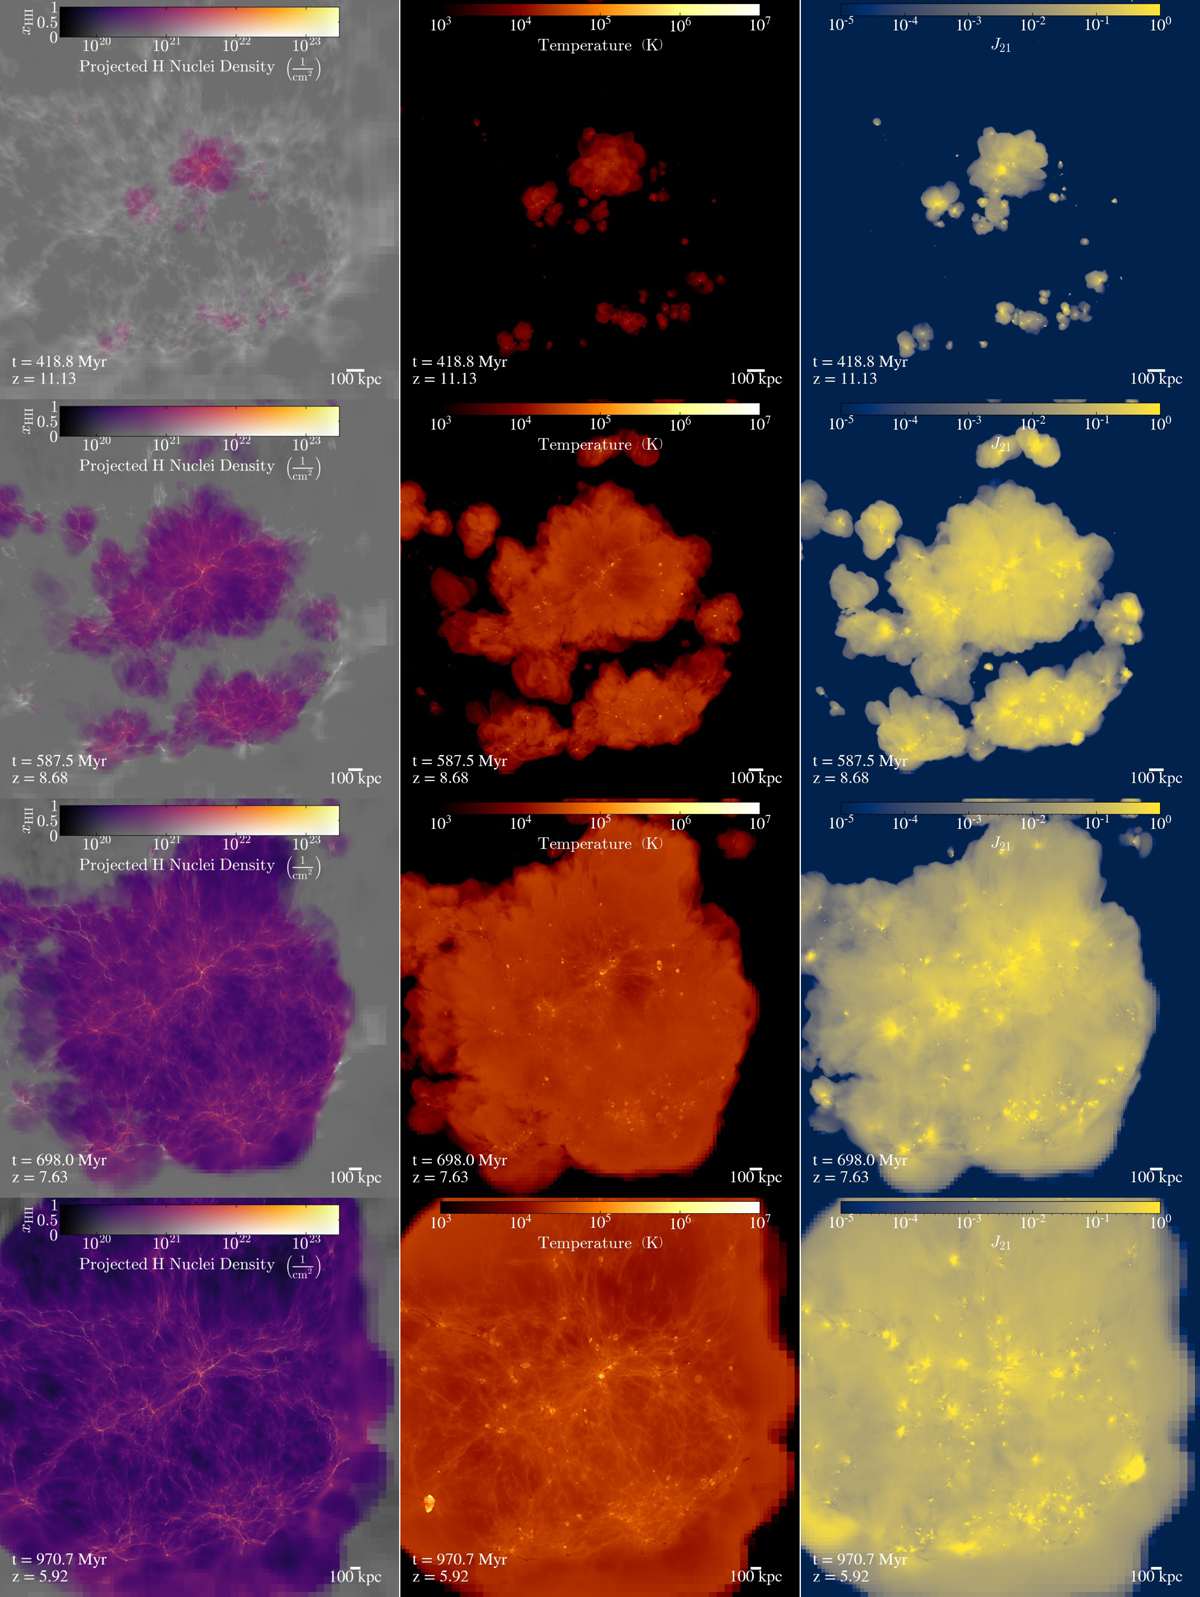
Illustration of the reionization of the volume. The four rows are four different snapshots at z = 11.13, 8.68, 7.63, 5.92, corresponding to a ionized volume fraction of the OBELISK universe of 1%,10%,50%, and 99%. The left column shows the gas density (brighter is denser) with the coloured vs. greyscale regions indicating ionized vs. neutral gas. The central column shows the gas temperature, with cold neutral gas in black, warm photoionized gas in dark orange, and hot shocked gas in yellow. The ionized regions can be mapped in the right panel to the local ionizing flux in units of J21 = 10−21 erg s−1 Hz−1 sr−1 cm−2. All three columns are mass-weighted projections.
Current usage metrics show cumulative count of Article Views (full-text article views including HTML views, PDF and ePub downloads, according to the available data) and Abstracts Views on Vision4Press platform.
Data correspond to usage on the plateform after 2015. The current usage metrics is available 48-96 hours after online publication and is updated daily on week days.
Initial download of the metrics may take a while.