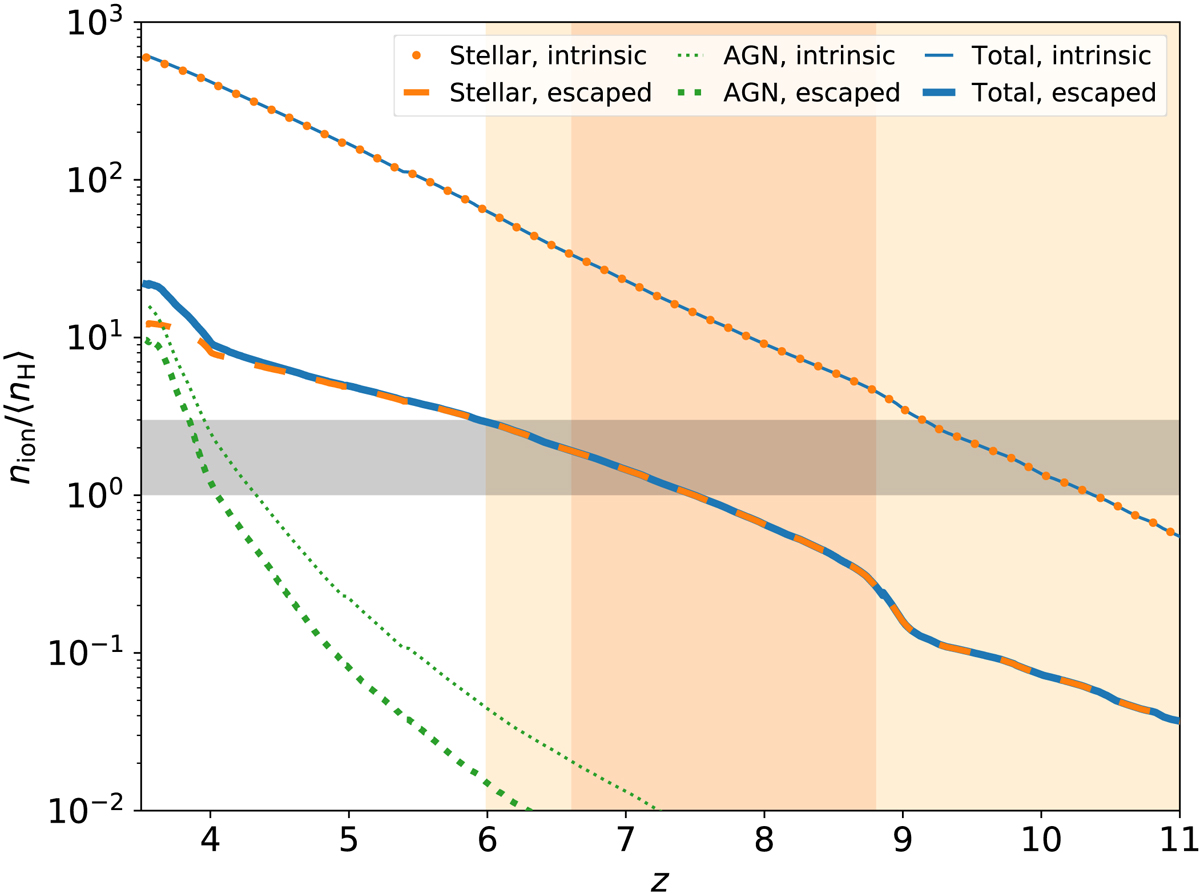
Fig. 14.
Download original image
Cumulative ratio of the number of produced (thin lines) and escaped (thick lines) ionizing photon to the average hydrogen density. The solid blue, dashed orange and dotted green lines correspond to the total contribution and that of stellar populations and AGN, respectively. For better readability, we show the intrinsic stellar contribution with dots instead of a line. The background shaded area indicates the z01 − z99 (z10 − z90) redshift intervals. The grey area highlights a photon-to-baryon ratio between 1 and 3, necessary to reionize the Universe. Stellar populations alone provide the necessary number of photons by z ∼ 6.
Current usage metrics show cumulative count of Article Views (full-text article views including HTML views, PDF and ePub downloads, according to the available data) and Abstracts Views on Vision4Press platform.
Data correspond to usage on the plateform after 2015. The current usage metrics is available 48-96 hours after online publication and is updated daily on week days.
Initial download of the metrics may take a while.