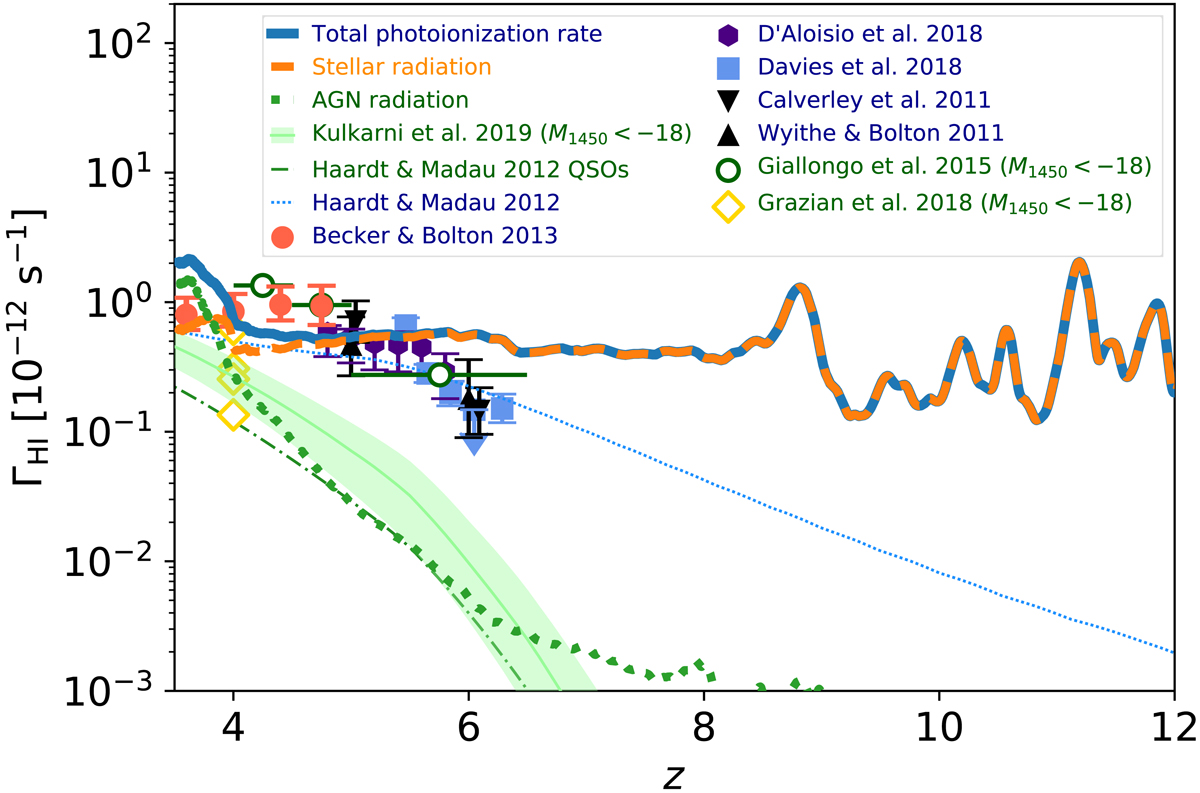
Fig. 17.
Download original image
Evolution of the H I photoionization rate in ionized gas (thick blue line) and the contributions of stellar populations (thick orange dashed line) and AGN (thick green dotted line), compared to the models of Haardt & Madau (2012) (thin dotted blue and dash-dotted green lines) as well as the constraints from the homogenized sample of Kulkarni et al. (2019) extending the AGN UV luminosity functon down to M1450 = −18 and other measurements (see text for details). Blue, orange and green labels correspond to the total photoionization rate, the stellar, and the AGN contribution, respectively. At z ≳ 4, and in particular during the whole EoR, the H I photoionization rate is completely dominated by the contribution of stellar populations.
Current usage metrics show cumulative count of Article Views (full-text article views including HTML views, PDF and ePub downloads, according to the available data) and Abstracts Views on Vision4Press platform.
Data correspond to usage on the plateform after 2015. The current usage metrics is available 48-96 hours after online publication and is updated daily on week days.
Initial download of the metrics may take a while.