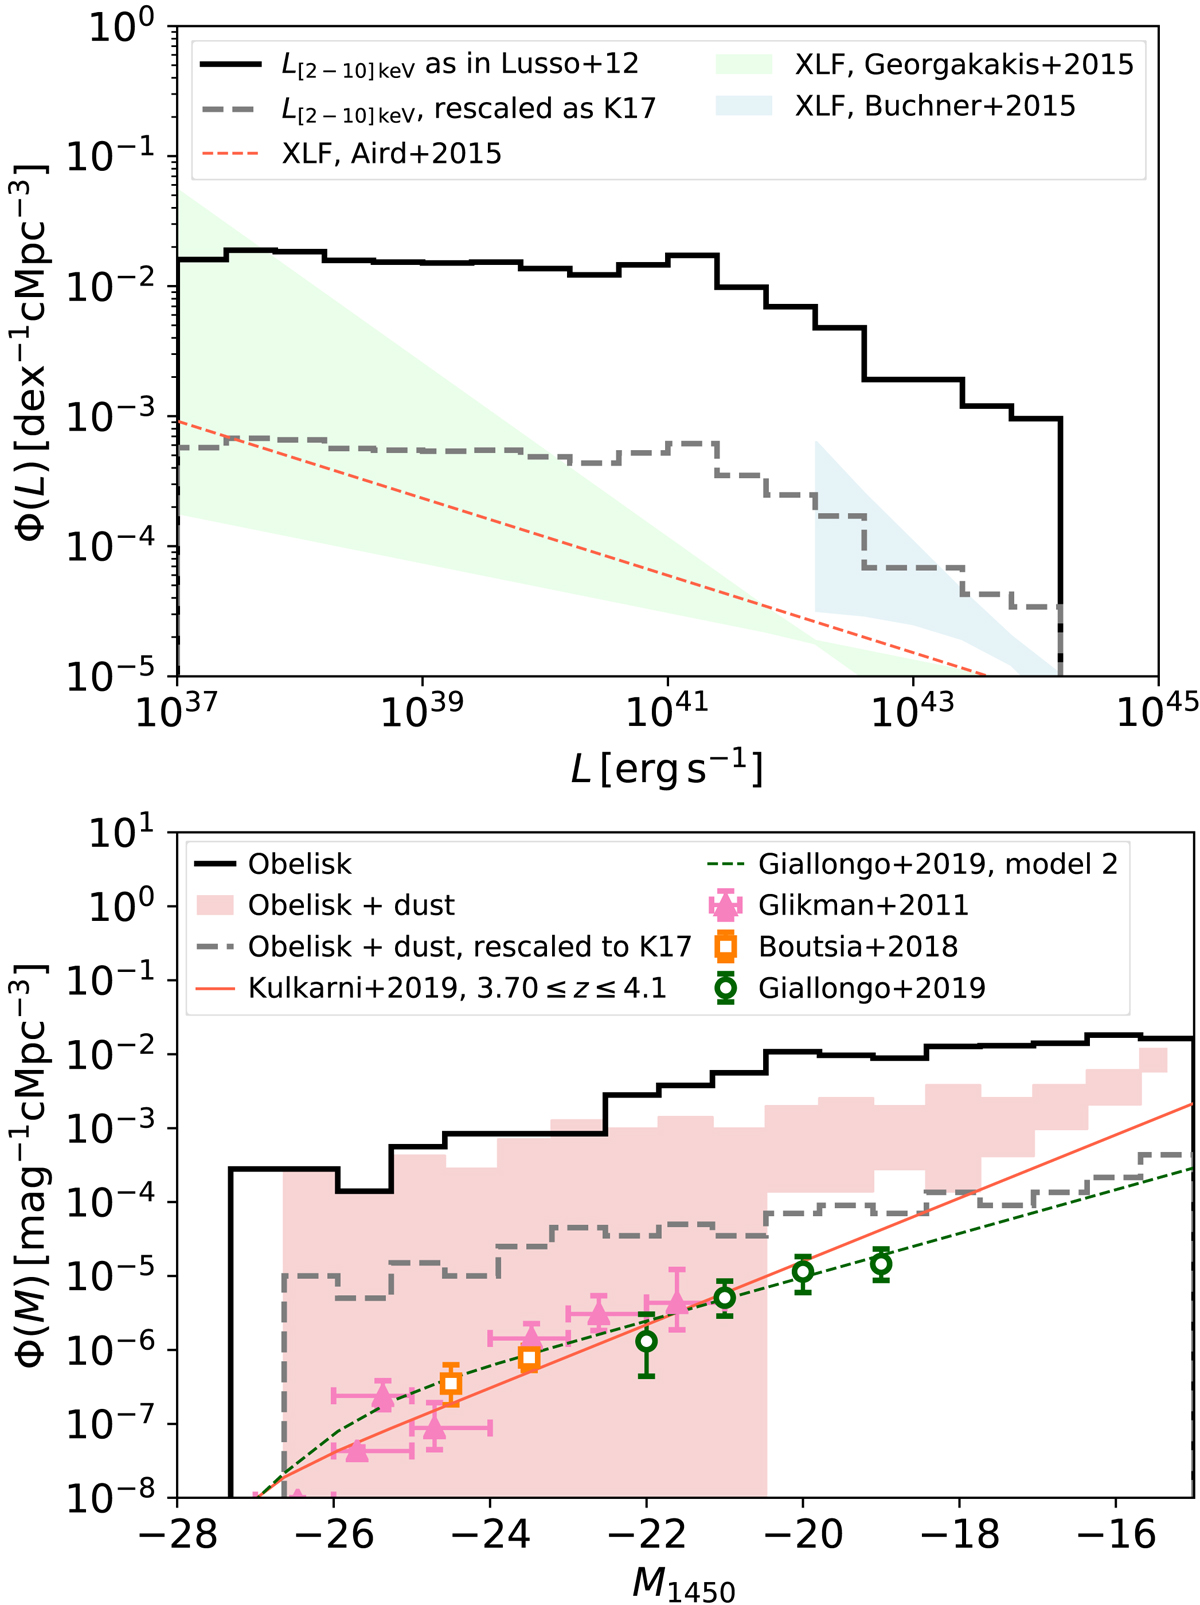
Fig. 8.
Download original image
AGN luminosity function. Top: AGN X-ray luminosity functions at z ∼ 4 from the simulation (solid black line) and rescaled to the field (dashed grey line) using the AGN excess found by Krishnan et al. (2017) at z ≃ 1.6. We compare our bolometric LF to the fit of Hopkins et al. (2007, blue line), our X-ray LF to the results of Buchner et al. (2015, red area), Aird et al. (2015, thin dashed line), and Georgakakis et al. (2015, green area). Bottom: AGN UV LF at z ∼ 4 without taking any obscuration into account (solid black line) and using the dust present in the simulation (red area, see text for details), compared to the data of Glikman et al. (2011, pink triangles), Boutsia et al. (2018, orange squares) and Giallongo et al. (2019, green circles) and to UV LF fits from of Giallongo et al. (2019, dashed green line) and Kulkarni et al. (2019, red line). We rescale again our AGN UV LF with a lower limit of the dust attenuation (dashed grey line) following the excess found by Krishnan et al. (2017).
Current usage metrics show cumulative count of Article Views (full-text article views including HTML views, PDF and ePub downloads, according to the available data) and Abstracts Views on Vision4Press platform.
Data correspond to usage on the plateform after 2015. The current usage metrics is available 48-96 hours after online publication and is updated daily on week days.
Initial download of the metrics may take a while.